Tag Archives: undefined

Forget Greece, Buy These U.K. ETFs Instead

Uncertainty regarding Greek debt negotiations has continued to dampen investor sentiment since the start of this year. To add to the crisis, Greece overwhelmingly voted against the austerity package offered by lenders last Sunday. This poses serious questions about the economic future of the nation and whether it will continue to use the euro. On the other hand, economic doldrums in the continent seem to have had little impact on the U.K. The country has outperformed the major economies, including the U.S., China and Japan, attracting investors’ attention in recent times. Greek Crisis In the recent past, several opinion polls have shown that a vote on the Greek issue of continuing to be a member of the common currency bloc would be a close affair. However, on Sunday, 61% of citizens voted against adopting further austerity measures, escalating the crisis further. Meanwhile, Greece needs to pay 3.5 billion euros to the European Central Bank (ECB) on July 20. Greece faces the threat of exiting the currency bloc if it fails to make debt payments to the ECB within the stipulated time frame. The failure to do so could also lead the ECB to trim its emergency lending to Greek banks, eventually hampering the country’s financial system. Additionally, Eurozone leaders gave Greece a Sunday deadline to submit new aid proposals. Greece needs to come up with new economic measures to avoid a default. On Tuesday, Greek Prime Minister Alexis Tsipras proposed short-term financing until the end of July from its lenders. Tsipras asked for an interim financing in exchange for some policy overhauls demanded by Greece’s creditors. Separately, the IMF said last week that the country would need a significantly large amount of funds for debt relief. Moreover, an economic crisis lasting more than seven years and youth jobless rates as high as 50% have put additional pressure on the economy. Why U.K.? While escalating Greek debt concerns continued to weigh on Europe, it’s the U.K. which has bucked the trend. According to official data, GDP rose by 0.4% for the January-March period. This is higher than the previous estimate of 0.3%. Additionally, year-over-year growth for the first quarter was also revised upward to 2.9% from the earlier estimate of 2.5%. GDP growth for 2014 was revised up to 3% from 2.8%. Also, the National Institute for Economic and Social Research estimated that the economy has expanded at a 0.7% clip in the second quarter. It is also projected that the economy will grow at a healthy rate of 2.5% this year. Reportedly, industrial output in the U.K. increased at a better-than-expected monthly pace of 0.4% in May. Also, the slump in oil prices and low inflation boosted consumer confidence in the region. A separate report showed that market research company GfK’s consumer confidence index increased by six points to a total score of seven in June, its highest point in 15 years. A year-on-year increase of 4.5% in first-quarter real disposable income was the sharpest pace of growth since 2001. Moreover, wage growth increased to 2.7% in April, witnessing the fastest pace of growth in four years. While private jobs rose 3.3% in April and the public sector posted a 0.3% gain, joblessness has declined in the U.K. for nearly six years. 2 U.K. ETFs to Buy The encouraging economic data indicates that the economy in the U.K. is on a solid footing and is emerging as the only hope in Europe. It is speculated that the country will continue on its robust growth path this year as well as the next. In this scenario, investors may consider the following two favorably ranked U.K. ETFs to strengthen their portfolio and offset Greek debt concerns. First Trust United Kingdom AlphaDex ETF (NYSEARCA: FKU ) This fund provides exposure to 74 firms by tracking the Defined United Kingdom Index. The fund has amassed $362.3 million in its asset base, while it has an average daily volume of around 97,000 shares. None of the firms account for more than 2.9% of the total assets. Sector-wise, financials take the top spot at about 30.7% share, while consumer discretionary and industrials also have double-digit allocation. FKU charges a fee of 80 bps annually and has a Zacks Rank #2 (Buy) with a Medium risk outlook. The fund has returned 10.9% over the past six-month period. SPDR MSCI United Kingdom Quality Mix ETF (NYSEARCA: QGBR ) With AUM of $2.7 million, this product tracks the MSCI UK Quality Mix A-Series Index. In total, it holds 112 securities with nearly 31.5% of its assets allocated to the top 10 holdings. From a sector look, financials take the top spot at 16.1%, while information technology, consumer staples, consumer discretionary, energy and industrials round off the top five. The ETF is the cheapest choice in its domain as it charges only 30 bps in annual fees. QGBR trades in light volume of around 4,000 shares a day. It has returned 3.7% in the last six months and has a Zacks Rank #2 (Buy). Original Post
The Natural Gas Market Remains Soft – UNG Is Slightly Down

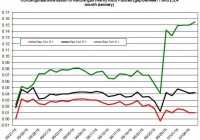
The price of UNG remains low and has declined by 2% since the beginning of the month. The weather is expected to heat up, but only in parts of the U.S. Will this be enough to drive up the demand for natural gas in the power sector? The natural gas market has started to cool down in the past couple of weeks, as the price of the United States Natural Gas ETF (NYSEARCA: UNG ) has declined by 2% since the beginning of the month. However, it’s still early to consider a downward trend in the price of UNG. And the market is still expected to remain soft in the near term, with higher-than-normal injections to storage, normal temperatures, robust production and low demand for natural gas. Unless the weather heats up, the price of UNG isn’t going anywhere. In the futures markets, contango has gone up mostly for the month of November – this is when the demand for natural gas is likely to pick up on account of higher consumption in the residential/commercial sectors (the start of winter). In November, the extraction season is expected to commence. (click to enlarge) (Data Source: EIA) But for the near-term contracts – September and October – contango hasn’t picked up by much, and as such, it’s not likely to have much of an impact on the roll decay of UNG. In the recent EIA weekly update , underground storage rose by 91 Bcf – a bit higher than market expectations, which stood at 86 Bcf. This was also higher than the 5-year average of 75 Bcf. Furthermore, in the coming weeks, analysts still project that the storage will rise at a faster pace than the 5-year average. Despite the higher pace in injections, the price of UNG has rallied in the past few days. Even the modest decline in natural gas consumption – down by 2% week on week, mainly due to lower consumption in the power sector – hasn’t driven down the price of UNG. The weather, which was expected to heat up, didn’t do so. The average temperatures were close to normal levels. Looking forward, the weather forecasts show colder-than-normal temperatures in parts of the west coast and the northeast. And warmer-than-normal weather throughout the south. Nonetheless, the cooling degree days (CDD) are expected to be higher: 19 degrees higher than normal and 27 degrees above 2014 levels. So we have a mixed signal about where the demand for natural gas in the power sector is heading this week. If the weather does turn out to be warmer than normal. The supply continues to slowly pick up, as production is still 5.4% higher than last year. Also, the number of rigs hasn’t changed much in the past few weeks: According to Baker Hughes , as of last week, the number of gas rigs slipped by 2 to 217. So far, this summer hasn’t been too hot. The power sector, which plays a more important role in this time of the year, relative to other sectors, has kept the price of UNG at its current low level. Unless the weather starts to heat up again, the injections will continue to be higher than normal and UNG will remain low. For more please see: ” On the Contango in the Natural Gas Market “. Disclosure: I/we have no positions in any stocks mentioned, and no plans to initiate any positions within the next 72 hours. (More…) I wrote this article myself, and it expresses my own opinions. I am not receiving compensation for it (other than from Seeking Alpha). I have no business relationship with any company whose stock is mentioned in this article.

Will China Pull Back Up SLV?

China’s possible economic slowdown may have contributed to the recent fall in the price of SLV. China’s demand for silver is expected to grow this year in part due to an increase in installation of solar panels. The physical demand for silver is less likely to impact the price of SLV. While all eyes are set towards the Greek debt crisis, the price of the iShares Silver Trust ETF (NYSEARCA: SLV ) has come down in the past few weeks. Some attributed the fall in prices , in part, to fears of an economic slowdown in China. Nonetheless, China’s demand for silver is still expected to rise this year. But will China pull up the price of SLV? As I have pointed out in the past, the physical demand for silver, while plays an important role in moving the price of silver, is still only secondary to the changes in the demand for silver for investment purposes. The same goes for China’s growing demand for silver. One of the main growing industries in China where the demand for silver has increased is in the photovoltaic business, i.e. the installation of solar panels. So far this year, China was able to ramp up its installation capacity – it reached 5.04 GW in the first quarter. This year, China set a high target of installing a total of 17.8 GW of solar PV. If so, this will account for nearly a third of the global solar PV installations for 2015. How much silver is needed to reach this 17.8 GW goal? According to PV-Tech , it takes nearly 80 tons of silver, or 2.8 million ounces of silver, to generate one gigawatt of electricity from solar. Considering China aims to install 17.8 GW, this means it will need around 50 million ounces of silver. On a global scale, with an estimate of 55 GW, the world’s demand for silver in the PV solar industry will be around 154 million ounces – nearly two and a half times the amount of silver consumed in this industry back in 2014; it’s also 14% of total physical demand of silver. Last year , however, this industry accounted for only 5.6% of the physical demand of silver. Moreover, the demand for silver in this industry has gone down since its peak year – 2011. Color me dubious, but I’m a bit skeptic that China will be able to reach such a high target, let alone need to ramp up its solar industry capacity so rapidly especially now that oil prices have gone down. Keep in mind, in previous years, the role of PV solar was small from the total global demand for silver. And China’s demand for silver, while important, hasn’t driven up the price of SLV in the past few years. But even if you do believe China’s demand for silver will rise and its economy isn’t slowing down, it’s still a stretch to consider this turn of events will increase the price of SLV. Thus, it’s less likely that China, even if it does increase its demand for silver, will drive up SLV. I think the drama in Greece, which has raised the uncertainty in the financial markets mainly in forex, and the potential change in the Federal Reverse’s policy in the coming months are likely to lead the way in moving the price of SLV. When it comes to the Fed, even though Yellen keeps promising it will raise rates this year, the market isn’t convinced: According to the bond market, the implied probabilities of a rate hike in September have fallen to only 14% and 50% in December. The minutes of the FOMC meeting revealed that some members still think it could be too soon to raise rates: “Most participants judged that the conditions for policy firming had not yet been achieved; a number of them cautioned against a premature decision.” Other members thought the conditions for a rate hike is plausible in the very near term: “Some participants viewed the economic conditions for increasing the target range for the federal funds rate as having been met or were confident that they would be met shortly. They identified several possible risks associated with delaying the start of policy firming. One such risk was the possibility that the Committee might need to tighten more rapidly than financial markets currently anticipate – an outcome that could be associated with a significant rise in longer-term interest rates or heightened financial market volatility.” The Greek saga could also push the rate hike to 2016 if Greece were to exit the EU; a Grexit could further raise the uncertainty in the financial markets and provide an excuse for the doves in the Federal Reserve to err on the side of caution by keeping rates low until the beginning of 2016 and see how the Greek exit plays out. China is expected to increase its demand for silver and the solar industry will likely to take a bigger role in the physical demand for silver. It’s still possible that China’s demand will grow slower mainly if its economy slows down. But as for the price of SLV, it seems less likely that even a higher growth path for China’s silver consumption will drive up, for extended periods, the price of this precious metal. (For more please see: ” Is SLV about to change course? “). Disclosure: I/we have no positions in any stocks mentioned, and no plans to initiate any positions within the next 72 hours. (More…) I wrote this article myself, and it expresses my own opinions. I am not receiving compensation for it (other than from Seeking Alpha). I have no business relationship with any company whose stock is mentioned in this article.