Tag Archives: undefined

Portfolio Strategy For Someone Just Starting Out

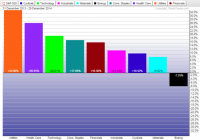
Summary This article is meant for folks who are just starting out in stock investing. It focuses on how to make a beginner’s portfolio, which is well diversified, relatively safe, but at the same time offers flexibility, a learning curve and room for growth. There are other simpler and passive alternatives, like buying a few diversified ETFs, but if you like to invest in individual stocks, please read on. This article is not for everyone. I know a vast majority of Seeking Alpha readers are by and large mature investors, considering how often we see a healthy debate in the comments section. But then there are others who are just starting out and not sure how to approach investing. It could be someone fresh out of college who just started working, or someone in their early 30s (or even later) who never thought of investing until now. The first-time investor often does not know where to start. Should they invest all of their capital at once, or should they invest over time? How much do they really need to save to have a diversified portfolio and how many stocks should they invest in? Most folks, who are just starting out, will buy few random stocks based on some article or tip, without a plan. Once they have bought a few stocks, they have no long-term or exit strategy either. This article will focus on the importance of a strategy, even when you are starting out with a relatively small amount of capital and how to form a starter portfolio. Where to start: First things first. a) Determine how much money you want to invest: How much do you want to start with and how much you are going to contribute on going-forward basis? I always prefer a staggered approach to investing. – Initial Capital – Monthly contribution b) Determine your risk profile: It will depend on your age, type of job/ employment you are in, your emergency funds situation and most importantly, your risk-tolerance (% of investment capital you can afford to lose in a worst case scenario). Based on all these factors, put yourself into one of these categories – High-risk, above-average risk, moderate risk, low-risk or extreme conservative. For the last category, though, investing in individual stocks is not advised. c) Decide on a brokerage company: There are several to choose from in terms of deposit requirements, features, trading commissions and fees. Some examples are Fidelity, TD Ameritrade, E*Trade, TradeKing, Interactive Brokers, Scottrade etc. If your account size is small (less than $10,000), you would probably be better off with an ultra-low commission broker like Interactive Brokers. d) What kind of account you would want to open: This depends on your overall goals and factors like, how long can you afford to keep this money locked in? The account-types can be a simple individual taxable brokerage account, or a retirement type account like an IRA or Roth-IRA. The IRA or Roth-IRA accounts come with certain restrictions like yearly contribution limits and income limits. Also, there are restrictions as to when and under what circumstances you can withdraw from an IRA account without penalty prior to the age of 59½. Most brokerage firms list them when you attempt to open an account. Be sure you are aware of them or read them carefully. e) Write your investment goals: Yes, write them. You can choose whichever medium you would like, paper or electronic. But please, write your short-term and long-term goals for the investment portfolio you are about to start. If you are still with me, let’s begin: We will assume that you are starting out with at least $5000 (or more) and then will add some money every month to bring your first year total investment capital to $10,000. Divide your money in four buckets of 25% each. – We will call the first bucket as “Core.” – The 2nd bucket will be “Income” bucket. – The 3rd will be “Growth.” – Lastly the 4th bucket will simply be called “Cash.” This will be the money sitting in cash most of the time. 1. “CORE” Bucket: Depending upon the size of your bucket, this money should be invested in “Dividend Champions” or “Dividend Aristocrats.” The best place to start is the list called Dividend Champions maintained by SA contributor “David Fish.” This list consists of over 100 well known companies who have paid and increased dividends for at least 25 years. Some well known examples are Coca-Cola (NYSE: KO ), ExxonMobil (NYSE: XOM ), Johnson & Johnson (NYSE: JNJ ), Procter & Gamble (NYSE: PG ) etc. You could also look at the Dividend Aristocrats that are S&P500 constituents and have paid growing dividends for 25 consecutive years. If your investment money in this bucket is only $2,500, you could still buy 4 or 5 individual stocks ($500 or $600 each), provided your trading commission is minimal (say $1 per trade). If your brokerage charges $5 or more, you will be restricted to fewer companies to keep your trading costs low. 2. Income Bucket: Why income? Some might argue, “Why should someone who is just starting out care for income from the investment portfolio?” There are a couple of important reasons why I am suggesting this. First, this will allow us to diversify into alternative assets like REITs, MLPs, Bonds and Munis etc., which typically offer higher yields than the ordinary stocks, including the dividend paying stocks like JNJ, KO, PG etc. Second, the income stream can either be reinvested in the same securities to compound or accumulated to invest into new stocks. Thirdly, it adds more stability (less volatility) to the portfolio. Lastly, let’s face it – everyone likes income; it simply adds to the motivation. Below are just some examples for further research. These are not recommendations, but just a place to start your own research. REITs (Real Estate Investment Trust): Realty Income (NYSE: O ), HCP, Inc. (NYSE: HCP ), Cohen & Steers Total Return Reality (NYSE: RFI ) MLPs: Kayne Anderson MLP Investment (NYSE: KYN ), Duff & Phelps Select Energy MLP fund (NYSE: DSE ) One can choose individual MLPs, but one should be aware of the tax implications. Bond/Utility/Munis/ Preferred funds: PIMCO Dynamic Credit (NYSE: PCI ), PIMCO Dynamic Income (NYSE: PDI ), Nuveen Muni High Inc (NYSEMKT: NMZ ), Cohen & Steers Infrastructure (NYSE: UTF ), iShares US Preferred Stock (NYSEARCA: PFF ) High Yield Div Stocks: AT&T (NYSE: T ) Verizon (NYSE: VZ ) It may be best to choose one name from each of the categories above. 3. Growth Bucket: This is your money to invest in “growth,” or even somewhat speculative names, based on your individual experience, age, comfort level and risk profile. Just make sure your position sizes are small. For example, if the bucket size was $2500, do not invest more than $500 in any one stock. Basically, this is the money you can use to develop your learning curve. This is not the “buy and hold” bucket, so don’t be afraid to trade a little more frequently. Don’t be shy to sell when you can realize substantial profits. However, before you invest, always keep in mind your risk-profile, small position-sizing and due diligence. Below is one rather relatively safe strategy that you can deploy in a Bull Market. However, this will not work very well in a prolonged downturn. This is also called “momentum” trading. Every 4 to 6 months, pick the 3 most favored sectors (ETFs) of the market during the previous 3 months, and invest equal amounts in each of them. Repeat the process every 3 to 6 months. For example, in the last 3 months, the most favored sectors have been Consumer Staples, Healthcare and Technology. 4. CASH Bucket: This is your 25% cash position. In practical terms, this will vary between 15 to 20% of the total portfolio. Ideally, in a late Bull Market like we have today, this bucket should be overflowing, whereas in a downturn it can be used selectively to make good use of the opportunities that the market may offer (this means loaning money to other 3 buckets). As soon as it falls below 10-15%, a conscious effort should be made to bring it back to 20-25% level by way of diverting dividends/income or by adding fresh money. Now let’s see how well this portfolio will fare based on certain parameters: Safety: Investing can never be risk-free. However, we can manage the risk, by diversifying into different type of assets. Our (above) portfolio will have almost 50% of the capital in Cash and Core stocks. Another 25% is in alternative assets to some degree. This will provide the relative safety and low volatility during a down market. Growth: For anyone who is just starting out, “growth” is very important. Some would argue that for early stage investing (especially younger folks), 90-100% of the money should be invested in growth stocks. Theoretically this may be true, but it is easier said than done. Most folks do not have tolerance for high volatility and large drawdowns (the kind we saw in 2008) and they often end up exiting the market at just the wrong time. In contrast, this portfolio strategy is focused on investing discipline and asset diversification. The 25% cash position will provide the confidence to face any serious downturn, as it will provide opportunities to buy good companies at discounted prices. In addition, the CORE bucket should provide significant growth over a long period of time, assuming the dividends are re-invested. The 25% growth-bucket will provide better growth with time as the investor gets over the learning curve and becomes more experienced. Risks: The first risk is of course the market risk, which is true with any investment. Secondly, if you happen to invest at the tail end of the Bull Market, you are likely to face some headwinds. But one can only know this in hindsight. One way to mitigate this risk is to stagger your investments over a period of time. If you plan to contribute a regular amount on a monthly basis, this will automatically stagger your purchases. The third risk is that this portfolio is likely to underperform in a raging Bull Market (like we saw in 1990s or even in 2013), but at the same time, this will outperform in a down or sideways market. Concluding Remarks: For some, this strategy may look a little complicated for a small portfolio. However if your plan is long term and you would like to grow this into a large portfolio with regular contributions and portfolio growth, I believe this is the right approach. There are, of course, simpler and passive alternatives like buying a few diversified ETFs and these would be perfectly fine for someone who has no time or interest to study and research individual stocks. However, if you want to be an active investor, you need to have a strategy. I believe any strategy is better than none at all, since investing based on a well-defined strategy forces the investor to be more disciplined. The strategy outlined above is not perfect or complete by any means. Over time, as you develop your skills, you can make improvements and make it perform better to suit your individual temperament and needs. Full Disclaimer: The information presented in this article is for informational purposes only and in no way should be construed as financial advice or recommendation to buy or sell any stock. Every effort has been made to present the data/information accurately; however, the author does not claim 100% accuracy.

When To Rebalance Your Portfolio

It’s that time of year again. Time to look at your portfolio and decide on your rebalancing strategy. Most investors know they should rebalance but many don’t do it or they get hung up on the detailed mechanics of rebalancing. In this post I’ll present a quick summary of rebalancing approaches and share my approach as well. We rebalance portfolios to improve risk adjusted returns over the long haul. In general, if portfolios are not rebalanced then the equity portion of the portfolio grows to dominate the overall portfolio and its risk. This is usually not something investors want especially as they age. After the decision to rebalance, the next question is how often. The frequency of rebalancing has to be traded off with the costs of rebalancing, transaction fees, commissions, etc… We also need to consider if we should rebalance if there is any difference at all in our target percentage allocations or wait until there is a significant enough difference to trigger an allocation decision. Say your target is 60% stocks and at the end the year you end up at 61% stocks. Does the benefit of rebalancing outweigh the costs? Probably not in this case. So, how does an investor choose the best approach? Fortunately, the great folks at Vanguard have done all the heavy lifting for us in this paper. Here is the summary table. (click to enlarge) As the above table shows basically there is not a big difference in rebalancing approaches, outside of never rebalancing. Even a monthly rebalance with a 0% threshold does not increase portfolio turnover and costs as much as you would expect. The last column also shows the results of never rebalancing – higher returns but with significantly higher volatility which leads to portfolio outcomes that most investors cannot stick with over time. These results also hold for quant portfolios. Whether implementing the IVY portfolios, the Permanent portfolios, Quant portfolios, the timing and threshold of the rebalance does not make a significant difference to long-term portfolio returns, e.g. see the IVY portfolio FAQ question #4. However, it is important to point out that there are periods where rebalancing does not work. Let me give you an example. The table below compares the returns of 60/40 stock bond and 70/30 stock bond portfolios with yearly rebalancing and no rebalancing over the last 5 years (2009 to 2013). (click to enlarge) As the table shows, yearly rebalancing increased returns for the 60/40 portfolio but yearly rebalancing actually decreased returns for the more aggressive 70/30 portfolio. This is typical in strong bull markets when stocks consistently outperform. This is maybe one of the reasons investors abandon rebalancing. But it is important to focus on the long term and more importantly on risk adjusted returns and stick to a rebalancing strategy. Personally, I rebalance once a year with a 1% threshold across all my portfolios regardless of strategy. But that is what I have found works for me. The best advice I can give anyone is to paraphrase the Vanguard advice – choose a regular periodic rebalancing approach that fits your investment style and that you can stick with over the long haul. This is most likely my last post for this year. Hope everyone has a Happy New Year! Here is to a great and prosperous 2015. At the beginning of the year I’ll be focusing on updating all the yearly returns for all the portfolios and strategies I track. I’m looking forward to sharing the results with everyone.

What Do 2014 Winners Say About 2015?

Summary The yield curve flattened in 2014 as short-term rates increased and long-term rates declined. Utilities benefited from lower long-term rates and is set to finish the year as the best performing sector. The U.S. dollar rally in 2014 looks like the early stage of a much larger rally. One of the biggest trends in 2014, for both length of time and the size of the move, was the bull market in long-term government bonds. The 30-year U.S. Treasury bond will finish the year near its highest level in decades. The 10-year treasury yield of nearly 2.2 percent is off the lows set in 2012, but near the levels reached at the depth of the 2008 financial crisis. There may even be room to move lower because that yield looks plentiful next to German and Japanese 10-year government bonds, which yield a paltry 0.55 percent and 0.33 percent, respectively. Investors who purchased iShares Barclays 20+ Year Treasury (NYSEARCA: TLT ) at the start of the year would be sitting on gains of more than 26 percent as of December 29. That is competitive with the best performing S&P 500 sectors in 2014 and gives it a better than 10 percent lead on both the S&P 500 Index and the Nasdaq this year. As for those best performing sectors, utilities and healthcare are set to grab the top two spots. (click to enlarge) In the currency market, a bull rally in the U.S. dollar kicked off in mid-summer against the yen and euro, and this extended to emerging market currencies by the start of autumn. The U.S. dollar heads into 2015 in a widespread bull market against all major currencies, with even the Chinese yuan showing signs of weakness. A Look Back At Interest Rates In 2014 This year started with investors expecting a rise in interest rates after the Federal Reserve began tapering its asset purchases in December 2013. The Fed ended its third round of quantitative easing (QE3) in October, but history proved superior to expectations: each time the Federal Reserve has exited quantitative easing, interest rates moved lower, not higher, and this time was no different. Rates peaked at the start of the year and never looked back, beginning an almost uninterrupted slide that has yet to finish. (click to enlarge) Economic growth failed to spur general rate increases. GDP growth dipped in the first quarter, then picked up strongly in the subsequent quarters, eventually climbing to 5.0 percent annualized growth in the third quarter. Despite these robust growth numbers, long-term bonds will close out 2014 at or near their highs for the year. Interest rates didn’t fall across the board though. The 2-year treasury yield has been rising since the Federal Reserve announced the taper in May 2013. The 5-year treasury yield didn’t gain in 2014, but it didn’t fall either. (click to enlarge) (click to enlarge) Rising short-term rates and stable or falling long-term interest rates makes for a flatter yield curve. A flat yield curve usually occurs in the middle of an economic expansion, when the economy is firing on all cylinders. Sector Performance Utilities and healthcare are the best performing S&P 500 sectors by a wide margin in 2014. Utilities last delivered a sector topping performance in 2011, when long-term interest rates sank to their lowest point in decades and stocks generally struggled-the S&P 500 Index gained only 2.1 percent that year. Going back further, utilities topped the list of S&P 500 sectors in 2006 as well. Investors with good memories will remember many early recession calls at that time due to a flat yield curve. Healthcare and utilities get lumped in with consumer staples as “defensive” sectors, but the strength seen in these sectors doesn’t indicate a weak market ahead. Healthcare has benefited mightily from the performance of the non-defensive biotechnology sector. SPDR Biotechnology (NYSEARCA: XBI ) is up more than 44 percent this year, for example, well ahead of the healthcare sector. If investors were looking for defensive plays, the sector would be led by pharmaceuticals or healthcare providers rather than biotechnology. Utilities are generally a conservative choice for investors, but the utilities sector was in a downtrend from 2009 to 2014. Working in the sector’s favor is a strong economy and lack of exposure to foreign markets. (click to enlarge) Currency Markets The U.S. Dollar Index broke out to a multi-year high in 2014 and will finish the year near its highs. The greenback was aided by six factors. First, the Federal Reserve tightened monetary policy with its exit from QE. Second, the European Central Bank is moving towards loosening monetary policy with its own version quantitative easing. Third, the Bank of Japan did a surprise expansion of QE on Halloween. Fourth, the collapse in oil prices dragged emerging market currencies lower. Fifth, China’s rebalancing has weakened emerging markets by reducing commodities demand. Sixth, the U.S. economy is among the strongest of the developed economies. The chart below is a price ratio of PowerShares DB U.S. Dollar Index Bullish Fund (NYSEARCA: UUP ) versus SPDR S&P 500 (NYSEARCA: SPY ). It shows that since July, investors could have earned more by investing in the U.S. dollar (going short a basket of foreign currencies that make up the dollar index) than from stocks. This is surprising for a bullish phase of the market-since 2008, U.S. dollar rallies have typically come along with stock market corrections. (click to enlarge) There is a lot of positive sentiment around the U.S. dollar, but structurally the global economy is still short the U.S. dollar. Well into 2014, for instance, Chinese property developers were borrowing in U.S. dollars . An extended U.S. dollar rally could be the only fuel needed for an even bigger and longer U.S. dollar rally if borrowers in emerging markets are forced to hedge their dollar exposure or repay debt. Rising interest rates in the United States, a bias towards rate cuts in China, plus easy money in Europe and Japan, puts the greenback in a strong position in 2015. What It All Says for 2015 Although sector performance in 2014 flashes a caution light, the yield curve is flattening, not flat. The yield curve would need to flatten much more before it would signal a possible recession, but the Federal Reserve isn’t going to raise rates enough to flatten out the yield curve in 2015. The U.S. economy continues to expand and the political situation is favorable for stocks. The Republican Congress and President Obama are unlikely to agree on much, but they do agree on trade deals and possibly even some tax reform. If the U.S. dollar rally continues into 2015, the macro environment will bear a striking similarity to the late 1990s. A continued rise in short-term interest rates is coming, at least until the Federal Reserve signals otherwise. It remains to be seen how long-term interest rates behave, but they could remain low whether short-term rates rise or fall. Far lower interest rates in Europe and Japan, in addition to the rising U.S. dollar, could keep a lid on interest rates if foreigners move capital into the U.S. bond market. Weakness in high yield debt, the fallout from low oil prices, will also work in favor of government bonds. Among S&P 500 sectors, utilities are most affected by the 10-year interest rates. This chart shows the 10-year treasury bond yield versus the price ratio of SPDR S&P 500 and SPDR Utilities (NYSEARCA: XLU ). The falling black line indicates XLU beating SPY, which has occurred for most of 2014 as interest rates declined. Utilities are unlikely to lead again in 2015, but as long as the rate environment isn’t a drag on returns, the strong economy and relatively high yield of the sector could keep it among the better performing sectors next year. (click to enlarge) If both short-term and long-term interest rates increase, the sector that stands to benefit the most is financials. Any broad ETF such as iShares US Financials (NYSEARCA: IYF ) or SPDR Financials (NYSEARCA: XLF ) delivers good exposure. The strong dollar and strong economy work in its favor, and if the dollar rally is a major trend in 2015, financials will benefit as foreign capital flows into the U.S. through American financial institutions. Under performing sectors such as energy and materials could rebound in 2015 after a dismal 2014, but if the global economy doesn’t pick up, a rally could be short lived. A major issue that could affect healthcare stocks in 2015 is the Supreme Court ruling on Affordable Care Act subsidies. The law as written does not allow subsidies for states without exchanges and if the Supreme Court were to rule against them, the history of the Obama Administration’s handling of the law suggests a period of confusion will follow. A Republican Congress doesn’t make the administration’s job any easier – if a fix requires Congressional approval, they may not get it. Finally, an important test for the euro will come in January. The European Central Bank meets in January and Greece’s election is at the end of the month. Sentiment is negative right now because the market expects the ECB to implement some type of QE policy and Greece to elect an anti-austerity government. If one or both of those things don’t occur, the U.S. Dollar Index, which has nearly 58 percent of its basket in the euro, could run out of steam at least temporarily. Barring such an outcome, the strong U.S. dollar will continue to weigh on stocks denominated in foreign currency. A QE policy in Europe would likely boost equity markets though, so funds that hedge away currency exposure, such as WisdomTree Europe Hedged Equity (NYSEARCA: HEDJ ), will do better than their unhedged competition.