Tag Archives: undefined

Entergy Corporation: A Derivative Play For The Gulf Coast Petchem Boom

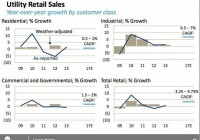
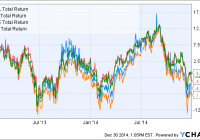
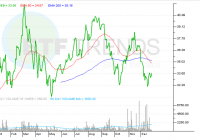
Summary Entergy is building a new power plant and has plans to build new transmission infrastructure. Load demand, not price hikes, is driving earnings growth. Shares are up considerably but I believe they still have a ways to run. It’s difficult to like utilities these days. With interest rates so low, utilities typically yield under 4%. To make matters worse, most states now have ‘renewable energy mandates,’ which means that utility companies are effectively mandated to invest in new energy infrastructure even when load demand is static. This leaves utilities with little choice but to raise rates in the coming years merely to recoup the cost of investment. On August 15th I wrote an article on Entergy Corporation (NYSE: ETR ), a Louisiana-based utility which I thought was the best alternative to the renewable energy hurdle facing US utilities today. Unlike most other states, Louisiana has opted out of renewable energy mandates. Louisiana’s economy is also benefitting greatly from an unprecedented boom in the petrochemicals industry along the gulf coast. This building boom includes everything from chemical plants, NGL crackers, steel mills and LNG export facilities. Since August 15th, Entergy has soared along with the rest of the space. Entergy has leapt from $72 per share to $91, thanks largely to falling interest rates. Right now, most US utilities are trading somewhere above their average P/E multiples, Entergy included. Does that mean it’s time to sell the stock and call it a day? That is what this article will try to answer. Load growth (click to enlarge) Courtesy of Entergy Corp Investor Relations This graphic pretty well sums up what Entergy expects in the coming three years. Residential use is expected to rise modestly, but industrial use will increase by around 6.75% per year, which will drive overall retail load growth by around 3.5% year on year. Utilities love industrial load growth, because it often begets residential load growth, which in turn brings commercial and governmental load growth. The petrochemical boom along the Gulf Coast could bring a decade of good times for utilities such as Entergy, which has business all throughout Louisiana and also in the Texas Gulf Coast. Utility companies must always consider replacing old generation and transmission infrastructure, but it’s easiest to do so when load growth is increasing, because the costs to build more capacity can be spread out on a larger customer base. Entergy is constructing another plant in Louisiana, one which the company believes will support economic growth in the region with low energy prices for years to come. The new power plant, named Ninemile 6, is a gas turbine. Ninemile 6 is scheduled to be ready by the first of next year, and it is the earliest of a very robust construction plan from Amite Parish in southern Louisiana to the Texas Gulf Coast around Houston. Through 2021, Entergy will build transmission lines for the new Cameron LNG plant and a new steel plant. New transmission lines will go up along the Gulf Coast, and eventually the company will upgrade its southeast Louisiana terminal equipment too. Next year, Entergy will spend $665 million. All the while, load demand increases and a focus on the most economical generation sources will keep rates down. With a kilowatt per hour cost of just 7.7 cents, Louisiana has the fourth lowest electricity cost in the nation (behind Kentucky, West Virginia and Washington state). A list of industrial projects underway on the Gulf Coast. Projects range from steel mills to LNG export terminals, and include several world-class companies. Courtesy of Entergy Corporation Investor Relations Valuation As I mentioned earlier, shares of Entergy have jumped up with the rest of the sector. Shares were somewhat below fair value back in August, but they are now just slightly above. Let’s take a look at FAST Graphs for a bigger picture. Courtesy of FAST Graphs In August, shares were well below their fair value and average P/E ratio. Now, however, shares are 13.4% above average P/E and just about at the Graham-Dodd ‘Fair Value’ number. (FAST Graphs measures this by trailing twelve-month earnings.) While Entergy may not be a great deal right here, I would also say that it is way too early to sell shares. Entergy’s 3%-4% retail electricity demand growth makes the company a better choice than most other utility names. Entergy is a multi-year play and I believe this stock has way more room to run. At twenty times trailing earnings Entergy would trade at $120. Given the company’s solid growth prospects, I think twenty times earnings would be a place to consider hopping off. For now, however, I believe that Entergy should be allowed to run for awhile. Conclusion Entergy is in the right place at the right time, and it is one of the only utilities I would consider owning right now. (In fact, it is the only utility which I currently own shares in.) Unlike most other utilities, Entergy is largely unburdened with the need to supply more expensive renewable energy to its customers. The petrochemical boom is fueled by a supply of cheap input costs in natural gas and natural gas liquids. This gives US petrochemical companies an advantage over the rest of the world, and this input cost advantage does not look to be going away anytime soon. Entergy is a relatively low-risk ‘derivative play’ for the petrochemical boom, and I believe shares have a good bit more ways to run before an investor should even consider taking anything off the table.

Selecting An Emerging Markets Value ETF

Summary Emerging markets have struggled over the past several years and may deserve a second look today. Value is a validated factor for outperformance that also works in emerging markets. This article analyzes three emerging market value ETFs in comparison to the benchmark EEM. Introduction In a previous article on emerging market low-volatility ETFs, we remarked that emerging markets had performed very well for most of the last decade, but have struggled coming out of the financial recession. This has made emerging markets one of the two cheapest global regions today (the other is Asia ex-Japan). Besides low volatility, “value” is an another factor that has been documented to lead to stock outperformance. In a recent paper from Robeco Asset Management, value, low-volatility, size and momentum premia were (re)confirmed to exist in emerging markets. Therefore, I was also interested to analyze the composition of several emerging market value ETFs to see which would be the best one to include in my own portfolio. Emerging market value funds The emerging market (EM) value funds under consideration are: iShares MSCI Emerging Markets Value ETF (NASDAQ: EVAL ), PowerShares FTSE RAFI Emerging Markets Portfolio (NYSEARCA: PXH ), and FlexShares Morningstar Emerging Markets Factor Tilt Index Fund (NYSEARCA: TLTE ). The benchmark iShares MSCI Emerging Markets ETF (NYSEARCA: EEM ) is also included for comparison. EVAL seeks to track the investment results of an index composed of emerging market equities that exhibit value characteristics. RAFI is fundamental-weighted ETF that selects and weights securities based on book value, cash flow, sales and dividends. TLTE seeks to enhance exposure to emerging markets by tilting the portfolio towards small-cap and value stocks. Fund details Data for EVAL, PXH, TLTE and EEM are shown below (source: Morningstar ). EVAL PXH TLTE EEM Yield 2.12% 3.05% 0.82% 1.69% Expense ratio 0.49% 0.49% 0.65% 0.67% Inception Feb 2012 Sep 2007 Sep 2012 Apr 2003 Assets $21.3M $367M $240M $32.2B Avg Vol. 2.7K 137K 21K 60.6M No. holdings 437 317 2057 817 Annual turnover 25% 24% 20% 22% We can see that PXH and TLTE are both relatively small funds, though their liquidity should still be sufficient for the average investor. EVAL is a tiny fund and has very low liquidity, which would result in higher bid-ask spreads. EEM, the benchmark ETF, is a giant by comparison. The expense ratios for the four EM funds are quite high, ranging from 0.49% to 0.67%, which is much higher than for domestic (US) funds. EVAL and PXH are both tied for the cheapest expense ratio at 0.49%, whereas TLTE has a higher expense ratio of 0.65%. The following table shows the top 10 holdings of the four funds. EVAL PXH TLTE EEM China Mobile 3.77 Gazprom 3.61 Samsung Electronics 2.31 Samsung Electronics 3.18 China Construction Bank 2.82 China Construction Bank 2.89 Taiwan Semiconductor Manufacturing 1.98 Taiwan Semiconductor Manufacturing 2.80 Industrial And Commercial Bank Of China 2.58 China Mobile 2.79 Tencent Holdings 1.44 Tencent Holdings 2.05 Bank of China 2.12 Industrial And Commercial Bank Of China 2.63 China Mobile 1.30 China Mobile 1.87 Hon Hai Precision 2.02 Taiwan Semiconductor Manufacturing 2.40 China Construction Bank 1.09 China Construction Bank 1.36 Gazprom 1.76 Bank Of China 2.34 Industrial And Commercial Bank Of China 0.99 Naspers 1.28 Mtn Group 1.62 Itau Unibanco Holding 2.14 Naspers 0.90 Industrial And Commercial Bank Of China 1.25 CNOOC 1.34 Petroleo Brasileiro 2.13 Itau Unibanco Holding 0.75 Itau Unibanco Holding 1.03 Hyundai Motor 1.27 Hon Hai Precision Ind 2.02 America Movil 0.74 Bank of China 1.02 Sasol 1.20 Reliance Industries 2.00 Bank Of China 0.70 America Movil 0.99 We can see these funds have quite a few of their top 10 holdings in common. Overlap The following table illustrates the overlap between the three EM value funds and EEM. Overlap statistics were obtained from ETF Research Center . EVAL PXH TLTE EEM EVAL – 49% 33% 52% PXH 49% – 35% 49% TLTE 33% 35% – 56% EEM 52% 49% 56% – We can see that there is a significant degree of overlap between the four funds. The three EM value funds have 33%-49% overlap between themselves, and 49%-56% overlap with EEM. In comparison, the low-volatility EM funds only had 2-31% overlap with EEM. The highest overlap is between TLTE and EEM (56%), while the lowest is between TLTE and EVAL (33%). Performance The graph below shows the performance of the three EM value funds and EEM since Dec. 2012 (2 years). EVAL Total Return Price data by YCharts We can see that the performances of the four funds have been relatively similar over the past two years. EEM has had the highest performance of -1.01%, followed by TLTE at -3.53% and EVAL at -4.25%. PXH had the worst return of -7.19%. The similar performances of the funds could be due to their significant amount of overlap between them. The following table shows further performance and risk data for the three EM value funds and EEM. Data are from Morningstar, except for volatility (2Y) and beta (2Y) which are from InvestSpy . EVAL PXH TLTE EEM 1-year return % -3.26 -5.59 -5.64 -3.04 3-year return (ann.)% – 0.01 – 3.22 5-year return (ann.)% – -1.96 – 0.93 Volatility (2Y) % 25.7% 18.2% 15.1% 17.3% Beta (2Y) 0.57 1.09 0.86 1.09 Sharpe ratio (3Y) – 0.15 – 0.37 Sharpe ratio (5Y) – 0.11 – 0.22 Surprisingly, EVAL apparently has a very high volatility compared to the other three funds, but a very low beta. However, I’m not sure if those metrics are reliable because EVAL is quite illiquid. When comparing PXH with EEM, we can see that the two funds have similar volatilities and betas. However, PXH has had a worse long-term performance. Valuation The table below shows various value and growth metrics for EVAL, PXH, TLTE and EEM. Data for all funds are from Morningstar (value metrics including dividend yield are forward looking). The first five rows can be considered as value metrics while the last five rows can be considered as growth metrics. EVAL PXH TLTE EEM Price/Earnings 10.06 9.51 11.78 12.76 Price/Book 1.08 1.02 1.26 1.49 Price/Sales 0.92 0.76 0.9 1.14 Price/Cash Flow 4.96 4.14 4.3 4.92 Dividend Yield % 3.62% 3.66% 2.72% 2.56% Projected Earnings Growth % 10.59 8.47 11.61 11.76 Historical Earnings Growth % -0.08 0.74 -28.77 -1.68 Sales Growth % -19.36 -11.82 -22.17 -13.79 Cash-flow Growth % 1.92 3.08 -3.97 7.85 Book-value Growth % -22.03 -27.25 -26.06 -21.57 We can see from the data above that all of the EM value funds have superior valuation metrics than EEM, as expected. Of the three EM value funds, PXH has the best valuation metrics, followed by TLTE. The funds also appear to have many negative growth metrics, which could be due to the effect of a global slowdown on the growth of many emerging market economies that rely heavily on exports or foreign investment. The EM value funds generally have worse growth metrics compared to EEM. Countries Perhaps the most important factor that would affect the performance of the EM value funds is the distribution of the constituent countries in the fund. The following table shows the top 10 countries in each of the three low-volatility EM funds and EEM (data from ETF Database ). EVAL PXH TLTE EEM China 20.60% China 24.48% China 20.01% China 17.52% Taiwan 12.69% Taiwan 14.54% South Korea 13.10% South Korea 13.64% South Korea 11.86% Brazil 11.30% Taiwan 12.22% Taiwan 12.20% India 7.35% Russia 8.89% India 8.51% Brazil 7.82% South Africa 7.23% South Africa 8.45% South Africa 7.73% South Africa 7.75% Mexico 5.26% India 7.92% Brazil 7.34% India 6.99% Brazil 4.56% Mexico 4.49% Mexico 4.53% Mexico 5.05% Malaysia 3.76% Turkey 3.18% Russia 4.08% Russia 3.94% Russia 3.69% Malaysia 2.54% Malaysia 3.73% Malaysia 3.66% Indonesia 2.70% Thailand 2.51% Indonesia 2.74% Indonesia 2.66% We can see from the above funds that all of them have China as the top holding. Taiwan also ranks prominently in all of the EM funds. South Korea is found as a top holding in all of the EM funds except PXH, probably because the FTSE Emerging Market Index does not include South Korea. I like the country distribution of PXH the most because it has the four cheapest EM countries as the top four holdings: China (PE: 7.1), Taiwan (PE: 13.9), Brazil (PE: 12.4) and Russia (5.5). Size The table below shows the size distribution for the four EM funds (data from Morningstar). EVAL PXH TLTE EEM Giant 49.7 58.6 36.4 50.6 Large 38.0 31.0 28.6 37.0 Medium 11.8 9.6 21.7 11.9 Small 0.5 0.8 13.1 0.4 Micro 0.0 0.0 0.2 0.1 And in graphical form: We can see that TLTE has the most even size distribution, as its investment mandate tilts its exposure towards smaller-cap stocks. EVAL, PXH and EEM have similar size distributions, with giant caps accounting for ~50% weight and large caps accounting for ~30% weight. Sector The final aspect to consider for the EM ETFs is their sector distribution. The following table shows the sector composition of the three EM value funds and EEM. Data are from Morningstar. EVAL PXH TLTE EEM Basic Materials 12.54 9.06 9.45 7.9 Consumer Cyclical 8.96 4.74 10.37 8.46 Financial Services 30.27 32.76 21.87 25.44 Real Estate 2.07 1.2 4.27 2.45 Communication Services 12.63 10.63 5.83 7.77 Energy 11.43 17.33 6.27 7.5 Industrials 5.49 3.85 8.58 5.72 Technology 8.84 13 18.61 20.95 Consumer Defensive 3.91 4.09 7.52 8.28 Healthcare 0.14 0.39 3.01 2.24 Utilities 3.72 2.97 4.23 3.3 And in graphical form: Similar to the low-volatility EM funds described in the previous article, financials again make up the highest allocation of the EM value funds. PXH also has a relatively high allocation towards energy, while TLTE and EEM have higher technology allocations. The following graph shows the sector distribution of the four funds (individual sectors are not marked). We can see that TLTE has the most even sector distribution out of the four funds. Conclusion The three low-volatility funds have had quite similar perfomances over the past two years, which could be due to the relatively high degrees of overlap between the funds. My pick for an EM value fund for my own portfolio was a close call between PXH and TLTE. (Unfortunately EVAL has to be excluded due to its low liquidity). TLTE had better sector and size distributions than PXH, and also exhibited a slightly better performance than PXH over the last two years. However, PXH has a slightly lower expense ratio (0.49%) and superior value metrics compared to TLTE. PXH also pays the highest dividend yield (3.05%) out the four EM funds studied. Finally, PXH contained a greater proportion of its weight in low PE countries. In the end, given that I was looking for an EM value fund, I selected PXH, the more “valuey” of the two funds, for my portfolio.

China Internet ETFs Look To Rebound In 2015

Summary Investors can use China-related ETFs to position for a turnaround in Chinese tech names. Closer look at a Chinese tech-specific ETF and broad China ETFs with tech exposure. An overview of the Chinese technology space. By Todd Shriber & Tom Lydon Despite the fervor surrounding Alibaba’s (NYSE: BABA ) September initial public offering, 2014 has been a disappointing year for exchange traded funds with exposure to Chinese Internet stocks. The silver lining in that scenario is that investors can scoop up ETFs such as the KraneShares CSI China Internet Fund (NASDAQ: KWEB ) and the Powershares Golden Dragon Halter USX China Portfolio (NYSEARCA: PGJ ) at favorable prices in anticipation of a significant 2015 rebound by Chinese Internet stocks. BitAuto Holdings (NYSE: BITA ) and Vipshop Holdings (NYSE: VIPS ) “may both advance an additional 32% in the next 12 months, according to average analyst estimates compiled by Bloomberg,” according to an article written for the news agency by Belinda Cao and Elena Popina . KWEB, the lone U.S.-listed ETF devoted exclusively to Chinese Internet stocks, allocates about 7.2% of its combined weight to Vipshop and Bitauto. The ETF has traded slightly lower this year. PGJ, the PowerShares offering, is not a dedicated China Internet ETF , but the fund does allocate a combine 58% of its weight to the technology and consumer discretionary sectors. That includes a 10% combined weight to Vipshop and BitAuto. While KWEB and PGJ have struggled this year, more traditional China ETFs with large weights to state-controlled enterprises have jumped amid rallies for those stocks, particularly financial services shares. For example, the iShares China Large-Cap ETF (NYSEARCA: FXI ) , the largest China country-specific ETF, is up 8.5%. Still, market observers see companies with exposure to the Chinese consumer, such as those held by KWEB and PGJ, as favorable plays for investors in 2015. “China’s 632 million Internet users still represent less than half of the country’s population, whose middle class was estimated at 200 million people by Alibaba Chief Executive Officer Jack Ma. Government data indicate the user total could rise to 850 million by 2015,” according to Bloomberg. Much of the 2015 potential and promise for China Internet ETFs will boil down to Alibaba’s ability to impress investors. The stock is KWEB’s largest holding at 10% of the fund’s weight. Although Alibaba is not currently a member of PGJ’s lineup, it could be in the future and it is unlikely that the ETF would rally in significant fashion if Alibaba languishes. The average analyst price target on Alibaba is just over $120 with two analysts forecasting prices of at least $130 . The stock currently trades around $106. The newly minted Emerging Markets Internet & Ecommerce ETF (NYSEARCA: EMQQ ) is another idea for investors to consider in the search for Chinese Internet exposure. EMQQ, which debuted in November, is not a dedicated China ETF, but the Emerging Markets Internet & Ecommerce Index devotes a significant portion of its weight to Chinese Internet names, including Alibaba, Tencent Holdings ( OTCPK:TCEHY ), JD.com (NASDAQ: JD ), Baidu (NASDAQ: BIDU ) and Vipshop. Those stocks combine for a third of the index’s weight . Nearly 30 of EMQQ’s holdings are Chinese companies. EMQQ’s underlying index allocates a combined 7.5% to Vipshop and BitAuto. KraneShares CSI China Internet Fund (click to enlarge) Todd Shriber owns shares of Alibaba.