Tag Archives: transactionname

ETG And ETO: What’s The Difference Between This Pair Of Confusingly-Named Eaton Vance CEFs

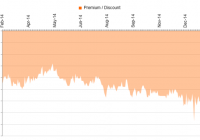
Summary Eaton Vance has a bad habit of using similar names for its CEFs; ETO and ETG are yet another example. The difference appears to come down to a different investment focus that may not be meaningful right now. Performance, meanwhile, has been vastly different. What’s in a name? When it comes to Eaton Vance closed-end funds, or CEFs, a single word or number is sometimes the only thing – but it can mean a lot… or sometimes a little. In the case of the Eaton Vance Tax-Advantaged Global Dividend Income Fund (NYSE: ETG ) and the Eaton Vance Tax-Advantaged Global Dividend Opportunities Fund (NYSE: ETO ), the switch of “income” and “opportunities” has meant a lot to performance though it’s tough to see how it changes the two portfolios at a high level right now. Seen this story before So ETG and ETO share a lot of the same traits as other Eaton Vance CEF pairs I’ve looked at, including ETB and ETV . For example, ETG and ETO both came public within the same three-month span in early 2004. The management team is identical. And the two funds have, word for word, the same objective: “The Fund’s investment objective is to provide a high level of after-tax total return.” That said, ETG, the older of the two funds, is a much larger fund with around $1.4 billion in assets to ETO’s around $350 million or so. On the surface, this suggests that ETG’s IPO went a little more smoothly than ETO’s IPO, which wouldn’t be surprising since coming back to the same customers a second time with a similarly named fund would probably be a hard sell for brokers. However, there’s also the issue of “opportunity.” Look at that performance When I looked at previous pairs of Eaton Vance CEFs, their performance was different, but fairly similar. One fund would have an edge over the other, but not a commanding lead. That’s not the case with ETG and ETO. For example, according to Morningstar’s total return figures, which include reinvesting of distributions, ETV and ETB’s trailing five-year annualized returns through the end of January were 11.4% and 11%, respectively. The edge goes to ETV, but just slightly. For EOS and EOI , the trailing 10-year annualized returns were 7.2% and 6.4%, respectively. A wider lead with EOS getting the edge, but still fairly close. ETO and ETG, on the other hand, had trailing 10-year annualized returns of 8.6% and 5.8%, respectively. That’s a much wider margin that clearly favors ETO, the smaller of the two CEFs. Interestingly, the two other pairs I’ve examined each outperformed the Morningstar categories in which they were placed over the time periods noted above. However, this pair was split. ETO outperformed while ETG trailed the World Allocation Morningstar category over the trailing ten years through January, and both had roughly similar standard deviations, a measure of volatility, over the trailing decade. That said, over the trailing one, three, and five-year periods through January, ETG is the better performer. Although it’s hard to attribute ETG’s short-term outperformance and ETO’s long-term outperformance to any one thing, the last few years have been relatively bad for natural resources while the years before that were extremely good ones for that segment of the market as China’s growth fueled huge demand for commodities. Which brings us to a major difference. What gives? The biggest difference I could find was in the fund highlight sections of the funds’ fact sheets. For ETO, “The Fund employs a value style, and may emphasize investments in common stocks of issuers whose business are related to ‘hard assets,’ such as energy, other natural resources during periods of high inflation or rising concerns about inflation.” ETG’s fund highlight provided the more bland: “The Fund employs a value investment style and seeks to invest in dividend-paying common stocks that have the potential for meaningful dividend growth.” While that could easily explain the short-term/long-term performance difference, the two portfolios are fairly similar today. For example, the two have roughly similar allocations to U.S. stocks, foreign stocks, and preferred stocks. Their global allocations are pretty close. And seven of their top ten holdings are the same. Looking at their sector allocations, both funds are both materially overweight in the financial sector (largely a result of their preferred holdings), with ETG appearing to stick closer to the benchmark overall. Both have about the same amount of leverage (neither uses an option strategy). And their yields based on market price are around the same area, with ETO offering an 8.1% yield and ETG a 7.8% yield, according to the Closed-End Fund Association. Another notable difference, however, arises with regard to discounts. ETO is trading at around 3% discount versus ETG’s about 8.5% discount. ETO’s discount is well below its 5-year and 10-year averages of around 9%. ETG is about in line with its 10-year average discount, but wider than its 5-year average of around 6%. Hard to call I can give a convincing argument to the fact that ETO is the better long-term performer with a higher yield. And, based on that, it’s a better option, but you should wait for a pullback. I could also go with the argument that ETG is trading at a wider discount and has been a better performer of late, so despite its slightly lower yield, it’s a better option right now. In the end, I think the difference should come down to the different focus on natural resources. In the current environment, ETO’s ability to focus on this sector isn’t particularly helpful. However, if natural resources pick up again, it could be. That would likely lead it to outperform ETG again. However, if you prefer a global offering that sticks a little closer to its benchmark, ETG would probably be the better call. Disclosure: The author has no positions in any stocks mentioned, and no plans to initiate any positions within the next 72 hours. (More…) The author wrote this article themselves, and it expresses their own opinions. The author is not receiving compensation for it (other than from Seeking Alpha). The author has no business relationship with any company whose stock is mentioned in this article.

Managed High Yield Plus Fund: A 9% Yield And A 12.5% Discount Is Hard To Resist

Investors are showing renewed interest in high-yielding junk bonds. With yields of government bonds near record lows, high yield bonds look increasingly attractive. Concerns about exposure to the energy sector appear overblown, especially as oil is now rebounding. Closed end funds offer some of the highest yields and still trade at significant discounts to net asset value. The Managed High Yield Plus Fund offers a rare combination of high yields and professional management, while trading at a major discount to net asset value. Managed High Yield Plus Fund (NYSE: HYF ) is a closed end fund or “CEF” that is professionally managed by UBS (NYSE: UBS ). It primarily invests in high yield bonds and offers a generous yield of nearly 9%. Besides the high yield, there are a couple of other compelling factors, including the fact that this fund pays the dividend on a monthly basis and it is trading at a historically wide discount of about 12.5%, to net asset value. The dividend also appears secure since this fund is earning more each month than it pays out. Let’s take a closer look: (click to enlarge) As the chart above shows, this closed end fund is currently trading for an exceptionally large discount to net asset value and one that is historically wide. The 3-year average discount to net asset value has been 5.78% and the 5-year average has been less than 2%. With the discount now at nearly 12.5%, this appears to be an exceptional buying opportunity. As of February 14, 2015, the net asset value is $2.18 per share and yet these shares are trading for just $1.91 per share. It’s worth noting that this fund has average earnings per share of about 1.37 cents per month, which clearly more than covers the monthly dividend it pays. That is important because it shows that the dividend is secure, and this reduces potential downside risks for investors. To see this and other information, you can see this fund data . This fund has around 359 holdings, which shows it is well-diversified. This diversification reduces potential downside risks for investors. Another consideration for bond investors is duration risk, however, this fund has an average maturity of just about 5.6 years, which means duration risks are low. This fund’s annual expense ratio of just 1.64%, which is low compared to many closed end funds. This fund pays a 1.35 cent per share dividend each month and the next payment is coming up soon. The dividend is payable on February 27th to shareholders of record as of February 19, 2015. The ex-dividend date is February 17, 2015. (click to enlarge) The SPDR Barclays High Yield Bond Fund (NYSEARCA: JNK ) is a popular way for investors to buy high yield bonds. As the chart above shows, junk bonds experienced a decline in mid-December over concerns that some energy companies could be more likely to default due to the plunge in oil prices. These concerns now appear overblown and oil has recently been trending higher. A Financial Times article points out that nearly $3 billion flowed into junk bond funds during the week of February 11, 2015 and this trend could be poised to continue, as the European Central Bank’s new bond buying program is creating more demand for high yield assets. A recent Bloomberg article details why investors are pouring back into junk bond funds, and that concerns over the plunge in oil are diminishing, it states : “Junk bonds are benefiting from demand for higher-yielding assets as the European Central Bank’s new round of bond purchases pushes yields on more than $1.7 trillion of debt worldwide below zero. The resurgence is sending down borrowing costs for speculative-grade borrowers and reopening a new-issue market that all but shut at the end of the year as oil tumbled below $45 a barrel from more than $107 in June. A rebound in crude has also boosted risk appetite. “With rates getting so low, you look at high-yield and it doesn’t look so bad,” Jack Flaherty, a money manager at New York-based GAM USA Inc., which oversees $17 billion, said in a telephone interview. “That has brought investors back in after the volatility at the end of last year scared them away. The fears from weak oil, while not gone, have lessened.” For all the reasons mentioned above, it makes sense to consider this fund if you are seeking generous yields, a monthly payout that is well-covered by current earnings, and professional management. The discount of nearly 12.5% to net asset value is an added bonus because if the discount narrows back to more historical levels, investors could also be positioned for significant capital gains. Here are some key points for the Managed High Yield Plus Fund, Inc.: Current share price: $1.92 The 52 week range is $1.75 to $2.19 Annual dividend: 16 cents per share (or 1.35 cents per month), which yields about 9% Data is sourced from Yahoo Finance. No guarantees or representations are made. Hawkinvest is not a registered investment advisor and does not provide specific investment advice. The information is for informational purposes only. You should always consult a financial advisor. Disclosure: The author is long HYF. (More…) The author wrote this article themselves, and it expresses their own opinions. The author is not receiving compensation for it (other than from Seeking Alpha). The author has no business relationship with any company whose stock is mentioned in this article.

American Century Makes Its Liquid Alts Move

By DailyAlts Staff American Century has been fairly quiet on the liquid alternatives front as the product category has experienced a boom since the 2008 financial crisis. In 2011, the firm launched two “130/30” funds and a market-neutral fund, and it has been operating another equity market-neutral fund since 2005, but American Century has largely been on the sideline of the liquid alts movement. That is, until now. On February 3, American Century filed paperwork with the Securities and Exchange Commission (SEC) seeking approval for three new alternative mutual funds. The firm has also initiated a new brand for its alternatives business and filed to trademark the brand “AC Alternatives,” which is used on the new line of alternative mutual funds. The AC Alternatives Income Fund The AC Alternatives Income Fund’s stated objective is providing investors with “diverse sources of income.” In pursuit of this objective, the fund’s managers will combine several distinct strategies designed to capture current yield, while also seeking to protect inflation-adjusted purchasing power through capital appreciation. Some of the fund’s strategies and investments will include: Corporate credit strategies Structured credit strategies Real estate strategies MLP strategies Income-oriented equity strategies The fund will also pursue PWP overlay strategies, which involve “exploiting market opportunities, managing inflows and outflows of fund assets and/or hedging against certain risks” identified by sub-advisor PWP. Arrowpoint Partners and Good Hill Partners are also listed as sub-advisors to the fund, but according to the prospectus, PWP “may make recommendations to the advisor to terminate and replace underlying sub-advisors from time to time.” The AC Alternatives Equity Fund The AC Alternatives Equity Fund will employ several equity strategies, with low correlation to one another and the broad market, in pursuit of capital appreciation. As with the AC Alternatives Income Fund, PWP is a sub-advisor and PWP overlay strategies are among the equity strategies that will be utilized by the AC Alternatives Equity Fund. Other strategies include: Long-only Long/short Event driven Trading oriented strategies In addition to the overlay strategies, PWP will also sub-advise the fund’s event driven and trading strategies, while Passport Capital will sub-advise its long/short equity strategies. The AC Alternatives Multi-Strategy Fund Finally, the AC Alternatives Multi-Strategy Fund will pursue four distinct strategies managed by four different sub-advisors, as well as four additional strategies sub-advised by PWP. The strategies, which span asset classes, are listed below with their sub-advisors in parenthesis: Long/short credit (Good Hill Partners) Long/short credit (MAST Capital) Event driven (Levin Capital) Long/short equity (Passport Capital) Overlay (PWP) Global macro (PWP) Real assets (PWP) Trading strategies (PWP) American Century’s Existing Alts The three new alternative mutual funds will join American Century’s current lineup of liquid alts, which include a pair of “130/30” funds (arguably not an alternative strategy since it has a beta of 1.0 to its benchmark) and a pair of market-neutral equity funds. The “130/30” funds, which average 130% long and 30% short equity exposure, have outperformed their long-only counterparts. The American Century Core Equity Plus Fund (MUTF: ACPVX ), with approximately $170 million in fund assets, has a five-star rating from Morningstar and generated a 14.99% return for the year ending January 30. The American Century Disciplined Growth Plus Fund (MUTF: ACDJX ), with approximately $33 million in fund assets, also has a five-star rating, and it generated an even better 20.21% return for the year ending January 30. The American Century Market Neutral Value Fund (MUTF: ACVVX ) launched at the same time as the two “130/30” funds and currently has approximately $76 million of fund assets. It has a four-star rating from Morningstar and generated a 3.31% return for the year ending January 30, which was still enough to rank it in the top 19% of its category. American Century’s oldest liquid alts product, the American Century Equity Market Neutral Fund (MUTF: ALHIX ), also has a four-star rating. It returned 2.07% for the year ending January 30 and currently has approximately $117 million of fund assets. For more information, visit americancentury.com .