Tag Archives: transactionname

PPL Remains On Track Despite Spin-Off

When a company spins off part of its business, it may look like shareholders lost money, but in most cases, it’s just a technical adjustment. PPL’s stock hasn’t “fallen,” per se, but instead PPL shareholders now own a portion of newly-created Talen Energy, a stake of which they can do with what they want. After the spinoff, PPL management reaffirmed its 2015 ongoing EPS guidance of $2.05-$2.25, as well as its expected earnings CAGR of 4%-6% through at least 2017. Certainly there’s been a lot of share-price noise at PPL as of late, but the firm continues to execute, and we still like the utility. By Kris Rosemann PPL Corp’s (NYSE: PPL ) shares have been adjusted lower recently, as the firm officially completed the spinoff of its energy supply business June 1. The move finalizes PPL’s transition to a focus on regulated utilities in the US and UK. PPL’s spinoff, now trading under the name Talen Energy Corporation (Pending: TLN ), also includes the addition of RJS Power of Riverstone Holdings. As previously announced , all of the common stock of Talen Energy will be distributed pro rata to PPL shareholders. PPL shareholders received ~.1249 shares of Talen Energy common stock for each share of PPL owned as of May 20. Fractional shares were not issued; instead they were aggregated and sold in the open market, with the cash proceeds distributed pro rata to PPL shareholders. The affiliates of Riverstone Holdings will receive common shares of Talen Energy in compensation for RJS Power, resulting in their owning 35% of Talen Energy. PPL shareholders will own 65%. After the spinoff, PPL management reaffirmed its 2015 EPS from ongoing operations guidance of $2.05-$2.25, as well as its expected compound annual earnings growth rate of 4%-6% through at least 2017. The firm expects substantial rate base growth in the coming years, projecting a CAGR of 7% through 2019, though we note currency headwinds from its UK operations will continue to negatively impact earnings in the near term. Management also stated as recently as February of this year that it expects dividend growth potential to become realizable following the spinoff. The dividend potential of Talen Energy remains to be seen, but the assets that make up the company generated $4.3 billion in revenue in 2014. The newly-created firm will boast a competitive cost structure and the financial agility to pursue additional growth options. At its inception, Talen’s generation capacity of about 15,000 megawatts will be primarily located in the Mid-Atlantic and Texas, two of the largest and most competitive energy markets in the US. Its generation mix is approximately 43% natural gas or oil, 40% coal, 15% nuclear, and 2% hydroelectric. The energy-generating plants will continue to be operated and maintained by the same employees before the spin off, and the firm’s leadership team is partially comprised of former PPL leadership. The drop in PPL’s share price should not come as a surprise, and intuitively, it makes sense. Though at face value it appears that PPL shareholders suffered a decline in the value of their position, the spinoff is a net-neutral one in the sense that the value lost by PPL shareholders in the market will be realized by the receipt of new Talen stock and cash distributions. Our opinion of PPL is relatively unchanged following the spinoff, and we maintain the company is still one of the best-performing utility companies available. We see no need to adjust our holding of PPL in the Dividend Growth Portfolio, though we may view the new shares of Talen Energy as a source of cash. Our fair value estimate already reflects the anticipated spinoff. We value shares of PPL at $30 each at the time of this writing. Disclosure: I/we have no positions in any stocks mentioned, and no plans to initiate any positions within the next 72 hours. (More…) I wrote this article myself, and it expresses my own opinions. I am not receiving compensation for it (other than from Seeking Alpha). I have no business relationship with any company whose stock is mentioned in this article. Additional disclosure: PPL is included in the Dividend Growth Newsletter portfolio.
TYO: The Worst Inverse Bond ETF

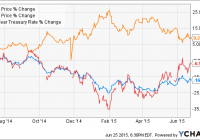
Summary TYO has a high expense ratio. It is illiquid. The ETF is too volatile and does not adequately cover its underlying market. Introduction I have written a number of articles about my favorite inverse bond ETFs. I have also compiled a comprehensive list of the inverse bond ETFs I hate the most. I have discussed these securities extensively over the past few weeks, because I believe we are in an economic environment unavoidably poised to experience rising interest rates. Inverse bond ETFs can be used shrewdly to capitalize on this market inevitability, and they are valuable hedging tools for bond-heavy portfolios. However, there is long list of risks associated with investing in an inverse bond ETF, and it is prudent to research and analyze each security before investing. For this reason, I decided to write an article about the single worst inverse bond ETF on the market, the Direxion Daily 10-Year Treasury Bear 3X Shares ETF (NYSEARCA: TYO ). What Makes an Inverse Bond ETF Bad? When evaluating an inverse bond ETF, it is important for an investor to find a security that has a low expense ratio and correlates well to its underlying index. The three most important metrics for determining the quality of an inverse bond ETF are liquidity, expense, and coverage. A good inverse bond ETF has a low expense ratio, is highly traded, and maintains assets with wide coverage. A bad inverse bond ETF does just the opposite. Another metric that ought to be considered is the strength of the underlying institution that issues the inverse bond ETF. If the institution cannot honor an investment, an investor stands to lose everything. Another factor that ought to be considered is the inverse bond ETFs’ leverage multiple. Inverse Bond ETFs come in three sizes: 1X, 2X and 3X . 2X and 3X ETFs are designed to multiply the returns (or inverse returns) of the daily performance of an underlying index. 1X ETFs follow the daily returns of its underlying index one for one. Since 3X inverse bond ETFs track daily returns by three times, the risks already associated with inverse bond ETFs are exacerbated exponentially. Compounding risk greatly affects the returns of 3X ETFs particularly when tracking range-bound indexes. To read more about the risks of 2X and 3X leveraged ETFs, read my article here . TYO Analysis TYO is the worst inverse bond ETF because its expense ratio is high, it is not highly traded, it does not have wide coverage, and it is triple leveraged (which magnifies the risks associated with investing in it particularly for periods longer than one day). TYO is really the only option for 3X exposure to intermediate-term US Treasury bonds, however, just because it is the only option, does not mean it is a good option. It is the responsibility of issuing institutions to produce a good product that creates its own demand. TYO simply fails in all regards. I included a graph as more of a visual aid to show how TYO works. TYO Performance I included a graph mainly to show how TYO performs relative to its underlying index. The Direxion Daily 10-Year Treasury Bull 3X Shares ETF (NYSEARCA: TYD ) (green) is the 3X bull for 7-10 year Treasury bonds and TYO (orange) is the bear. I also included 10-year Treasury yields to show the correlation between bonds, yields and inverse bond ETFs. From a broad perspective, TYO is well correlated to 10-year yields and provides the results an investor would hope and expect from its underlying index TYD (about .99% correlation). TYO Analysis Continued On the surface, TYO seems to perform the job it is meant to perform. To see how TYO fails, one must examine the security closely. First, TYO’s net expense ratio is very high. The industry average for much more respected and liquid inverse bond ETFs is about 0.9%. Based on TYO’s total assets however, its average competitor has a net expense ratio of about 0.7%. TYO itself boasts one of the highest net expense ratios at 0.95% . What this means is, the investor must pay 0.95% just to hold TYO. The biggest risk of holding TYO, however, is its liquidity risk. It has an average volume of 10,228. TYO’s price is 18.15*10,228=$189,320. Basically, the ETF is off limits to any wealthier investors or money managing firms. Those who hold TYO run the risk of not being able to sell when they want, or causing a drop off in price when attempting to sell large volumes. Either way it’s a huge risk that can be avoided by investing in a more liquid inverse bond ETF. Lastly, TYO only has 49 million in total assets. It does not have an adequate amount of market exposure to fully correlate to changing market conditions. Conclusion The market speaks loudly and prices drive demand. An overpriced inversely leveraged ETF like TYO is going to have very little volume because investors do not want the risk. It is 3X leveraged, so it is designed to be inherently volatile. I can only imagine a poor investor losing money and being unable to sell their shares because no one is buying (or selling). Pick a better, more liquid ETF like the ProShares UltraShort 20+ Year Treasury ETF (NYSEARCA: TBT ) if you are trying to utilize an inversely leveraged ETF. Disclosure: I/we have no positions in any stocks mentioned, and no plans to initiate any positions within the next 72 hours. (More…) I wrote this article myself, and it expresses my own opinions. I am not receiving compensation for it (other than from Seeking Alpha). I have no business relationship with any company whose stock is mentioned in this article.

RSX: The Bear Thesis

Summary Ruble will continue to weaken. The economy is in bad shape, and production was not helped by the weak ruble. The oil is looking weak too, which is very dangerous for the Russian oil producers and the economy. Despite recent weakness, the Russian Stock Market (NYSEARCA: RSX ) is still up almost 25% year-to-date. The wild moves seen in last December are almost forgotten. However, I see several reasons why RSX can go lower. The Russian Ruble The Russian currency has somewhat stabilized after falling to as much as 80 rubles per dollar in December of 2014. Currently, you can buy a dollar with 55 rubles. However, I see reasons why the ruble could go lower, hurting the dollar-denominated RSX. The first reason is the key interest rate. The key rate, which was increased to 17% by the Russian Central Bank at the height of the crisis, was recently lowered to 11.50%. This move helped the bank stop the rally in the Russian ruble. The Central Bank also started buying $200 million per day in order to bring the reserves back to $500 billion. At the end of May, international reserves stood at $356.8 billion. In my view, the key rate will be lowered further, because the economy is in a bad shape. In April, industrial production fell ( Google translate link ) by 4.5%. In comparison, industrial production fell by just 0.6% in March. This means that the ruble is not weak enough to help local producers, which will make the Central Bank more eager to bring interest rate down and push the ruble lower. The Economy As I mentioned above, production is stagnating. So is consumption. In May, real earnings of Russian citizens contracted ( Google translate link ) by 6.4%. According to official estimates, it would take three years to bring earnings back to the level of 2014. This fact means problems for the consumer-oriented part of RSX holdings like Sberbank ( OTCPK:SBRCY ), Magnit (retailer), VTB Bank, and Mobile Tele Systems (telecom). The decrease of consumer spending could especially hurt Magnit, which has been growing very fast and opened 1,618 new shops last year. The budget is stretched, and the Russian Ministry of Finance is even ready to cut the sacred cow – military spending. Oil Russia is still overly dependent on oil prices, and I’m bearish on oil. Brent oil managed to make a spectacular run from under $50 per barrel to almost $70 per barrel. The decline in the number of U.S. rigs and conflicts in the Middle East help oil gain ground. In my view, oil has run out of upside catalysts. The conflicts in Yemen and Iraq are very far from being resolved, but this does not lead to an upside in oil. The number of working rigs in the U.S. has dropped by more than 50% compared to 2014, but this fact no longer helps oil. Despite recent cuts, supply still exceeds demand, and this means more pressure on oil prices. Pressure on oil hurts the economy, and hurts Russian oil producers, like Surgutneftegas, Lukoil ( OTCPK:LUKOY ) (and Tatneft ( OTCPK:OAOFY ), which are heavily represented in RSX. Bullish Argument The eternal bullish argument for the Russian market is its undervaluation based on different metrics. Interestingly, in Russia, this argument, which was widely used five or ten years ago, is now stated with sarcasm. Yes, you can still choose the metric that you like, choose the peers and find out that Sberbank, Gazprom ( OTCPK:OGZPY ) and others are relatively undervalued. In fact, they have always been. This undervaluation is chronic and, in my view, nothing will change on this front unless the country goes through serious structural changes. Bottom line I am bearish on RSX. I believe that the combination of weaker oil, sluggish economy and falling ruble will send RSX closer to lows seen in December of 2014. Disclosure: I/we have no positions in any stocks mentioned, but may initiate a short position in RSX over the next 72 hours. (More…) I wrote this article myself, and it expresses my own opinions. I am not receiving compensation for it (other than from Seeking Alpha). I have no business relationship with any company whose stock is mentioned in this article.