Tag Archives: transactionname

PureFunds Cyber Security ETF: Troubling Inconsistencies And Specific-Holding Concerns Should Make Investors Think Twice

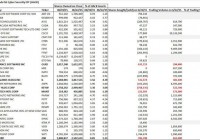
Summary Due to increased investor interest in the cyber security space, the PureFunds Cyber Security ETF has grown rapidly since its launch in November 2014, with assets now exceeding $1.2B. Its track record has been impressive, returning nearly 22% since inception. Our tracking of the recent semi-annual reconstitution, however, raises some troubling questions about the validity of the data that this ETF is reporting. Specifically, reported changes in positions on reconstitution that occurred this past Monday, in several instances, seem to be impossible to have been executed based on that day’s trading volume data. Finally, we are concerned about the high level of ownership the ETF now has in several small cap names, and would caution investors regarding risks in owning these names. Background The PureFunds Cyber Security ETF (NYSEARCA: HACK ) was launched in November 2014 to track the ISE Cyber Security Index, and seeks to provide investors with exposure to the hot cyber security technology sector. The index (and ETF) provide exposure to large, well-known cyber security plays, such as Palo Alto Networks (NYSE: PANW ) and FireEye (NASDAQ: FEYE ), in addition to other large cap technology companies such as Cisco (NASDAQ: CSCO ) and Juniper Networks (NYSE: JNPR ) that, while not pure plays, are deemed to be relevant to cyber security. At a high level, the index owns companies that fall into either the cyber security infrastructure, or cyber security services sub-categories, with the infrastructure group making up the overwhelming majority of the index. One of the lesser understood features of the index, however, is that it seeks to equal weight its components within the infrastructure and services sub-categories. A complete explanation of the index’s construction methodology can be found here . This unique index construction means that small-cap (and even micro-cap) stocks are weighted similarly in many cases to large-cap stocks. Herein lies some issues that we recently came across when analyzing this past Monday’s index/ETF reconstitution. Recent Index/ETF Reconstitution According to ISE index methodology and the HACK ETF methodology , components are re-weighted twice annually, on market close on the third Friday in December and June (and become effective the following Monday), the most recent reconstitution of ISE Cyber Security index having occured on this past Friday’s market close, June 19. The index weighting changes were announced after the close on that date. The HACK ETF, in order to track the underlying index, must then adjust their holdings, i.e. buy/sell the individual stocks held, in this most recent case on Monday, June 22 to realign themselves with the index. PureFunds posts its daily holdings in HACK as of the close each day, along with the ETF’s underlying Net Asset Value (or NAV), total assets, etc. Thus holdings can be tracked on a daily basis. As expected, there were large changes in the end of day holdings reported in HACK between Friday, June 19 and Monday, June 22, with the changes being inline with the newly announced stock weightings of the underlying ISE index. Below we show the reported holdings as of each close on these two dates in HACK, as obtained directly from their site (linked above) along with analysis of shares bought/sold on June 22 (note that we only did the analysis for US-listed stocks): (click to enlarge) (Source: PureFunds site for daily share ownership, Yahoo for June 22 trading volume) As can be seen from the data above, there are several stocks for which the supposed buy/sell volume from HACK exceeded 100% of the June 22 total trading volume in that stock. We have highlighted in bold in the table above the stocks we are referring to. Clearly, this raises some troubling questions as clearly HACK could not have traded more than 100% of the day’s total volume: Is HACK accurately reporting their end of day holdings in the ETF? Is the end of day reported NAV therefore accurate? If these shares were in fact traded on either 1) different days than June 22, 2) across multiple trading days, or 3) yet to be fully traded, then why were the end of day share holdings reported as the above by PureFunds? We do not profess to know the answers to these questions, despite our attempts to understand their trading/reporting methodology through reading their prospectus linked above. We, nonetheless, find the inconsistency of their reported data to be troubling and thus would be cautious in relying on both claimed share holdings AND reported NAV, which investors in HACK rely on to assess the fair market value of the ETF. Note that we have contacted PureFunds, sent them this data, and asked for an explanation, but have received no response . If we do get a response from them, we will certainly share it with our readers. Ownership concentration in small cap names As noted above, the HACK ETF (and underlying index) have an unusual equal-weighting (rather than market cap weighting) structure that causes the ETF to have outsized ownership of certain small cap names. The two that we’d highlight specifically, for which the ETF has the highest percentage ownership of shares outstanding are below: Company Ticker HACK shares owned 6/23 S/O from latest 10-Q HACK % ownership Widepoint Corp WYY 7,532,622 82,135,803 9.2% KEYW Holding Corp KEYW 3,463,191 38,222,484 9.1% We highlight Widepoint (NYSEMKT: WYY ) and KEYW Holding (NASDAQ: KEYW ) specifically because they are the two stocks that HACK has the highest percentage ownership (both now approaching 10%), though there are other small-cap names for which HACK ownership is now 5.0% or greater, namely Intralinks (NYSE: IL ), Guidance Software (NASDAQ: GUID ), and Zix Corp (NASDAQ: ZIXI ). We specifically are concerned about these stocks because 1) they have all seen significant share price increases recently, we believe, driven primarily by fund flows into HACK, which disproportionately are allocated into these small cap names per the index methodology, 2) we question whether, even if HACK fund inflows remain robust, the ETF will be comfortable owning 10% or more of any individual stock (which would then require filings with the SEC as a ‘beneficial owner’ in the stock and Form 4 reporting within 2 business days of any buy/sell transaction, and perhaps, most importantly, potentially make the ETF subject to “Short-Swing” liabilities). For those not familiar with beneficial ownership reporting requirements, Short-Swing rules, etc, here is a useful summary presentation . We severely doubt that the HACK ETF would wish to exceed 10% ownership in any of these names. Therefore, we believe the recent appreciation in the names, driven primarily by HACK ETF buying, is likely nearing an end, thus leaving a sudden dearth of buying to support these names and making them very susceptible to pullbacks in the absence of the somewhat artificial buying from HACK. Conclusion We are troubled by the seeming inconsistency of the data reported by HACK and thus question both the accuracy of its reported share holdings on a day-to-day basis, and the reported NAV. We would thus avoid owning HACK as a means for gaining exposure to cyber security. Alternatively, we would suggest that an investor instead own individual cyber security stocks which they know and are comfortable with (we are long PANW, and have been for some time, as an example). We would also highly caution against owning and even encourage selling the small cap names which we highlighted above, that we believe have been temporarily, and somewhat artificially, bid up by the HACK ETF. We believe all could be subject to (potentially substantial) pullbacks before too long. We would be especially cautious in WYY and KEYW, where HACK ownership is already nearing the key 10% threshold. Disclosure: I am/we are long PANW. (More…) I wrote this article myself, and it expresses my own opinions. I am not receiving compensation for it (other than from Seeking Alpha). I have no business relationship with any company whose stock is mentioned in this article. Additional disclosure: We may initiate long or short positions in any of the named securities at any point.
PHK: Is It Time To Get Out While You Still Can?

Summary Pimco High Income Fund’s premium has fallen from over 50% to around 30%. The net asset value isn’t the issue, investor perception is. I strongly recommend investors reconsider their position here before it’s too late. Pimco High Income Fund (NYSE: PHK ) is a risky investment. Although the fund has a solid performance history and has steadily paid dividends through even the “worst of times,” it trades at an extreme premium over net asset value, or NAV. It’s easy to give short shrift to that little issue when times are good, it’s harder to ignore when the tide starts to shift. And just such a shift may be taking place right now. OK, it’s got a good record I’m not going to argue that PHK is a poorly run fund. Quite the contrary, it is a well run fund. For example, over the trailing 10-year period through May, the fund’s annualized NAV total return was around 11%. Total return includes reinvested distributions. That puts the fund in the top tier of its Morningstar peers. It’s performance over the trailing three- and five-year periods were even more impressive, at 19% and nearly 18%, respectively. Equally important, the fund’s distribution has been maintained through thick and thin. That includes through the disastrous 2007 to 2009 recession that led to distribution cuts throughout the CEF industry. I have concerns with the level of the distribution , at nearly 13% based on market price and 19% based on NAV, but that doesn’t diminish the consistency with which the dividend has so far been paid. So, yes, PHK has been a well run fund. If this were an open-end mutual fund the discussion would stop right there. But it isn’t, it’s a closed-end fund. Supply and demand Closed-end funds trade on supply and demand, which means their prices can vary from their net asset values. When investors are enamored of a CEF, they bid the shares up close to or above the NAV. When investors are less sanguine they push CEFs to discount prices – often very deep discount prices. This isn’t news to anyone who follows CEFs. PHK has been a market darling. It started the year with around a 50% premium over NAV. That’s massive and only exists because of investor sentiment. Investors at the start of the year were willing to pay $1.50 for $1 worth of assets. I have suggested a couple of times that this is a big risk. That stance had garnered a mixture of agreement and hostility. Those who disagree with my concerns basically suggest that the fund is so good that it deserves the premium pricing. Looking at more recent performance, however, suggests exactly why such a rich premium is a huge risk. Over the trailing three months through June 23rd, PHK’s market price return was a decline of over 18%. That’s a rough stretch to have lived through, even if the dividend has remained stable. And while investors can argue that impressive share price gains over the years means those losses are only taking back house money that misses the point. You see, PHK’s NAV return was a positive 5.5% over that same span. And since PHK’s NAV performance was positive during this span, it’s hard to suggest that the market price performance had anything to do with the fund’s NAV performance. It seems pretty clear to me that a significant number of investors have soured on the fund. Yes, there have been changes in the number of shares of PHK that are sold short . That, presumably, should ease negative sentiment. But, in the long run, this is noise. The short interest is a symptom of the bigger issue, which is the extreme overvaluation. A warning shot If you still own PHK, look at this swift reversal of fortune as a warning shot. Could the premium go right back up to 50%? Yes. Will it? Who knows. The drop, however, is clear evidence that investor perceptions are shifting. The value of a PHK share is still roughly 30% lower than where the shares trade today. In other words, there’s still plenty of downside left before it reaches NAV. Don’t underestimate that risk. Disclosure: I/we have no positions in any stocks mentioned, and no plans to initiate any positions within the next 72 hours. (More…) I wrote this article myself, and it expresses my own opinions. I am not receiving compensation for it (other than from Seeking Alpha). I have no business relationship with any company whose stock is mentioned in this article.

Best And Worst: Small Cap Growth ETFs, Mutual Funds And Key Holdings

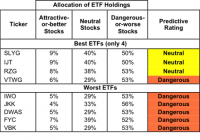
Summary Small Cap Growth style ranks 10th in 2Q15. Based on an aggregation of ratings of 11 ETFs and 498 mutual funds. SLYG is our top rated Small Cap Growth ETF and VSCRX is our top rated Small Cap Growth mutual fund. The Small Cap Growth style ranks 10th out of the 12 fund styles as detailed in our 2Q15 Style Rankings report . It gets our Dangerous rating, which is based on an aggregation of ratings of 11 ETFs and 498 mutual funds in the Small Cap Growth style. Figures 1 and 2 show the five best and worst rated ETFs and mutual funds in the style. Not all Small Cap Growth style ETFs and mutual funds are created the same. The number of holdings varies widely (from 29 to 1214). This variation creates drastically different investment implications and, therefore, ratings. Investors seeking exposure to the Small Cap Growth style should buy one of the Attractive-or-better rated ETFs or mutual funds from Figures 1 and 2. Figure 1: ETFs with the Best & Worst Ratings – Top 5 (click to enlarge) * Best ETFs exclude ETFs with TNAs less than $100 million for inadequate liquidity. PowerShares Fundamental Pure Small Growth Portfolio ETF (NYSEARCA: PXSG ) and Vanguard S&P Small Cap 600 Growth (NYSEARCA: VIOG ) are excluded from Figure 1 because their total net assets are below $100 million and do not meet our liquidity minimums. Figure 2: Mutual Funds with the Best & Worst Ratings – Top 5 (click to enlarge) * Best mutual funds exclude funds with TNAs less than $100 million for inadequate liquidity. Transparent Value Small Cap Fund ( TVSIX , TVSFX ) and Oak Associates River Oak Discovery Fund (MUTF: RIVSX ) are excluded from Figure 2 because their total net assets are below $100 million and do not meet our liquidity minimums. State Street SPDR S&P 600 Small Cap Growth (NYSEARCA: SLYG ) is our top-rated Small Cap Growth ETF and Virtus Small-Cap Core Fund (MUTF: VSCRX ) is our top-rated Small Cap Growth mutual fund. SLYG earns a Neutral rating and VSCRX earns an Attractive rating. One of our favorite stocks held by Small Cap funds is Universal Insurance Holdings (NYSE: UVE ), which earns a Very Attractive rating. Since 2009, Universal Insurance has grown after-tax profit ( NOPAT ) by 21% compounded annually. In addition to its NOPAT growth, the company has increased its return on invested capital ( ROIC ) to 39% in 2014, up from 16% in 2011. Economic earnings have also been positive since 2007. Despite the impressive profit growth achieved by Universal Insurance, the stock remains undervalued. At its current price of $24/share, UVE has a price to economic book value ( PEBV ) ratio of 0.9. This ratio implies the market expects Universal Insurance’s NOPAT to decline by 10% from current levels. However, as noted above, Universal has grown NOPAT by double digits over the past five years. If Universal Insurance Holdings can grow NOPAT by just 8% compounded annually for the next 10 years the stock is worth $38/share today – a 58% upside. Vanguard Small-Cap Growth ETF (NYSEARCA: VBK ) is our worst rated Small Cap Growth ETF and AllianzGI Ultra Micro Cap Fund (MUTF: GUCAX ) is our worst rated Small Cap Growth mutual fund. VBK earns a Dangerous rating and GUCAX earns a Very Dangerous rating. One of our worst rated stocks held by GUCAX is Cardiovascular Systems (NASDAQ: CSII ), which earns our Dangerous rating. NOPAT losses have increased every year since 2012, expanding from -$14 million to over -$33 million in 2014. ROIC has also been negative each year since 2012 and is currently -32%. This equates to Cardiovascular Systems destroying 32 cents of every dollar invested into the business. Despite all of this, CSII’s stock price does not reflect the company’s deteriorating performance. Since 2012, the stock has tripled in price. When considering the fundamental performance of the company over this period, we believe the stock to be overvalued. To justify its current price of $29/share, the company would need to achieve positive pretax margins immediately and grow revenue by 35% compounded annually for the next 18 years . This seems very optimistic given that the company has never grown revenue above 31% year over year, and has remained unprofitable while doing so. Figures 3 and 4 show the rating landscape of all Small Cap Growth ETFs and mutual funds. Figure 3: Separating the Best ETFs From the Worst ETFs (click to enlarge) Figure 4: Separating the Best Mutual Funds From the Worst Funds (click to enlarge) Sources Figures 1-4: New Constructs, LLC and company filings Disclosure: David Trainer and Allen L. Jackson receive no compensation to write about any specific stock, style, style or theme. Disclosure: I/we have no positions in any stocks mentioned, and no plans to initiate any positions within the next 72 hours. (More…) I wrote this article myself, and it expresses my own opinions. I am not receiving compensation for it. I have no business relationship with any company whose stock is mentioned in this article.