Tag Archives: transactionname

Invest In America With These 4 ETFs

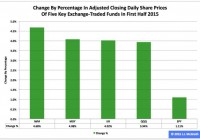
Now more than ever, it is a great time to invest in the United States. Foreign concerns are piling up around the world and a number of global economies appear to be teetering on the brink of more turmoil. Greece threatens to take the rest of Europe down with it in a debt spiral that could put extra focus on the rest of the eurozone peripheral economies in the process. China is also on the brink, as its latest steps seem unable to stave off a stock market slide in what had been one of the hottest corners of the globe to start the year. Meanwhile, here in the U.S., stocks are holding steady while we are seeing reasonably positive data on multiple fronts as well. Consumers remain confident, oil prices are moderate, construction spending is rising and unemployment remains a very small problem for many. As you can see by the preceding paragraphs, there is quite the difference between what is going on in the U.S. and what is happening in the rest of the major economies of the world. And this doesn’t even go into the peril that many emerging markets – or even commodity-focused nations – find themselves in right now. So if you are looking to make a targeted investment in the U.S., consider any of the four ETFs outlined below. These picks go across asset classes so there should be something for every investor who is looking to bet on the United States of America in a portfolio: First Trust RBA American Industrial Renaissance ETF (NASDAQ: AIRR ) If you are looking to bet on a resurgence in American industrial might and production, AIRR is a great choice. The fund focuses on small and mid cap stocks in the industrial and community banking sectors. The index starts with Russell 2500 index components and then eliminates all those that aren’t related to manufacturing or related infrastructure, as well as banking. Companies are then screened out which do more than one-quarter of their business beyond U.S. shores, or have a negative forward PE. For the banking component, only banks in traditional manufacturing hubs will be included in the holdings list. This approach looks to focus on small and midsized manufacturing companies that are selling to other U.S. firms or customers. And the banking component not only provides diversification, but acts as a secondary way to play a manufacturing boom as many small cap industrial companies will look here for their capital needs. PowerShares Build America Bond Portfolio ETF (NYSEARCA: BAB ) The Build America Bond program consists of taxable muni bonds which come with a 35% interest rate subsidy, paid to the issuer. This makes these taxable securities competitive on a cost and yield perspective for issuers and a solid choice for muni bond investors. And though the program ended as part of the American Recovery and Reinvestment Act, there are still plenty of these bonds outstanding, making them excellent ways to invest in America from a fixed income perspective. Investors should note that the duration is a bit high here coming in at just under 10 years, so interest rate risk is definitely something to consider. However, with the recent Greek issues, a rate hike could be postponed in the near term. And with a 30-day SEC Yield of about 4.2%, it definitely is an income destination. It has been a weak run for BAB as of late, but you can say that about many muni bond ETFs in the past few months, and especially those with more interest rate risk. However, if you are looking for a different type of muni bond ETF – and particularly one in the taxable market – BAB and the Build America Bond market will be tough to beat for betting on America in a fixed income portion of a portfolio. Teucrium Corn ETF (NYSEARCA: CORN ) The United States is the world’s biggest producer of corn by far, producing nearly as much as China, Brazil, and the entire EU bloc combined. And for exports, there is a similar story brewing with the U.S. easily leading the pack. This makes corn a great crop to invest in if you are looking to make a play on a U.S.-centric natural resource. Investors can play this commodity with the Teucrium Corn ETF which sees a decent amount of volume and AUM approaching $100 million. The fund doesn’t just invest in front month corn futures though, as it includes second to expire CBOT futures, third to expire futures, and then the December futures following the expiration month of the third to expire contact. Though the commodity is down against the S&P 500 through the first half of the year, it is slowly making a comeback and has gained about 13% in the past month. This big gain is due to a great crop report so be on the lookout for CORN later this summer as well. PowerShares DB USD Bull ETF (NYSEARCA: UUP ) Thanks to more global central bank easing and demand for safe havens, the U.S. dollar has been a strong performer as of late. And speculation that a rate hike could be coming at some point soon is certainly something that can’t be said for a number of other central banks out there which are moving in the other direction. You can easily bet on continued dollar strength with UUP though, as this ETF offers exposure that goes long in USDX futures against a variety of developed market currencies. The euro constitutes about 58% of the benchmark, 13% goes to yen, and then 11.9% is in British pounds and 9% in Canadian dollars. The fund is thus heavily dependent on the performance of the dollar against the euro but this has been a great trade for a while and could continue to be as long as the European debt crisis persists. Plus with a Zacks ETF Rank #2 (Buy), the longer term picture is looking bright for this ETF too. Original Post

ALLETE, Inc: Diversified Utility Seeking New Growth Areas

Summary The company just acquired another new wind facility. The company acquired U.S. water earlier in the year which will drive sales growth. 88% of revenue comes from its regulated utility side. It doesn’t get much more boring than ALLETE, Inc (NYSE: ALE ). The diversified utility based in Minnesota is pretty predictable considering 88% of its revenue is from its regulated utilities. It has been seeking new growth areas as of late. It has taken several steps to aid growth that look quite promising. This new diversification, a solid regulated business, and attractive dividend make ALLETE a great long-term pick in the utilities sector. Stepping back and looking at the company as a whole it is easy to see that it is a very diversified utility. Although it generates 88% of its revenue through its regulated business it also has several other segments. Below is the breakdown of the company’s holdings. (Source: ALLETE ) The regulated business has helped the company achieve steady growth over the past couple of years. This is illustrated by the fact that between 2010 and 2014 earnings grew at a compounded annual rate of 6.7%. All the while the company has been diversifying its portfolio. Through the small reoccurring growth in its regulated business and the higher growth possibilities in its other segments the company is forecasting annual EPS growth of 5% for the next couple of years. Along with this it also expresses that it will keep its dividend competitive and growing. Currently the shares sport a 4.3% yield making it very attractive to dividend investors. Specifically there are two areas which should take the company’s growth to the next level. Below I outline what the company is doing in terms of growing its portfolio and diversifying its business. U.S. Water The best example of the company further diversifying its portfolio is when earlier this year it aquired U.S Water. U.S Water is a integrated water management company that provides solutions to many industrial and commercial clients. The company serves clients nationwide and serves many Fortune 500 companies. (Source: ALLETE ) It has increased its customer base from 2,141 in 2011 to over 3,600 in 2014. It also has an excellent track record of retaining these customers with over 90% of customer being retained. In 2014 U.S Water did $120M in sales which the company forecasts will increase between 10-15% annually over the next few years. Considering ALLETE only has revenue of $1.16B in 2014 this is a very significant addition to the business. On top of that growing it at 15% would mean the company expects it to be pulling in nearly $160M by the end of 2016. U.S. Water continues to retain clients and add reoccurring revenue which compliments the regulated part of ALLETE’s business well. ALLETE Clean Energy Renewable energy has become even more popular in recent years as well as more economical. ALLETE has been expanding its clean energy business as it attempts to make its business more diversified and less reliant on fossil fuels. Over the past year it has increasingly built up its presence in this area, particularly in wind generation. This past November the company agreed to actually develop a wind farm for Montana-Dakota Utilities, which is a division of MDU Resources Group (NYSE: MDU ). In the agreement it will end up selling the wind farm to MDU for $200M. While I couldn’t locate the exact amount of capital the company will need to put into the development it did make it clear in the quarter one confrence call that it will have an effect on earnings. It should be noted that the effect of these earnings have not been factored into the earnings guidance the company has given thus far. Other than developing wind farms it has also been acquiring them for its own portfolio. Below are the wind farm aquistions the company has completed over the past couple of months. In December closed a deal to acquire 108 MW facility in Iowa. In January closed a deal to acquire 3 wind farms in 3 different states from AES Corp. (NYSE: AES ). In April closed a deal to acquire 98 MW facility from EDF Renewable. In June closed another deal with AES to acquire 101 MW facility in Pennsylvania. With the latest acquisition the company now has over 500 MW of wind generation in operation. Seeing as it has acquired majority of these this year it should be interesting to see the company grow this business in the next couple of years. In the conference call the company touched upon that it will also see positive effects for the year from these clean energy acquisitions. However, it expects its gains in this area to only offset the losses from the steel industry dynamics that face its Minnesota Power business. Conclusion ALLETE is further diversifying its portfolio to seek new areas of growth. Although it has yet to see positive effects from the newest acquisitions it should start to see them as the year progresses. With these new growth opportunities as well as an extremely strong regulated business to lean on it expects to deliver 5% earnings growth over the next couple of years. This should translate into further dividend growth adding attractiveness to the already high yield of 4.3%. I think as a long-term play ALLETE is making the right moves making itself more diversified and seeking new growth areas. Disclosure: I am/we are long AES. (More…) I wrote this article myself, and it expresses my own opinions. I am not receiving compensation for it (other than from Seeking Alpha). I have no business relationship with any company whose stock is mentioned in this article. Additional disclosure: Always do your own research before investing.

SPY’s 2015 2nd-Quarter Performance And Seasonality

Summary The SPDR S&P 500 ETF in the first half ranked No. 3 among the three most popular exchange-traded funds based on the S&P Composite 1500’s constituent indexes. In the second quarter, the ETF’s adjusted closing daily share price advanced by a rather small 0.22 percent. In June, the fund’s share price declined by a rather large -2.01 percent. The SPDR S&P 500 ETF (NYSEARCA: SPY ) during 2015’s first half was third by return among the three most popular ETFs based on the S&P Composite 1500’s constituent indexes, which encompass the SPDR S&P MidCap 400 ETF (NYSEARCA: MDY ) and the iShares Core S&P Small-Cap ETF (NYSEARCA: IJR ). SPY edged higher to $205.89 from $203.64, an increase of $2.25, or 1.11 percent, but it behaved worse than MDY by -2.98 percentage points and IJR by -2.91 percentage points. Figure 1: Change In Share Prices Of Five Key ETFs In First Half (click to enlarge) Source: This J.J.’s Risky Business chart is based on analyses of adjusted closing daily share prices at Yahoo Finance . Market day in and market day out, I analyze in multiple ways 13 ETFs through my Risky Business Daily Market Seismometer : These funds are SPY, MDY and IJR, as well as the nine Select Sector SPDRs and the small-capitalization iShares Russell 2000 ETF (NYSEARCA: IWM ). I also assess the large-cap (and technology-dominated) PowerShares QQQ (NASDAQ: QQQ ), albeit on a comparatively infrequent basis. Thanks to this monitoring, I anticipate being shocked by market events on occasion, but I do not expect being surprised by them. Anyway, SPY in the first half of the year was the worst performer among the five key ETFs I employ to evaluate equity classes by market cap (Figure 1). Figure 2: Change In Share Prices Of Five Key ETFs In Second Quarter (click to enlarge) Source: This J.J.’s Risky Business chart is based on analyses of adjusted closing daily share prices at Yahoo Finance. SPY was neither the best behaved nor the worst behaved of my five key ETFs last quarter, as these distinctions were claimed by QQQ in the former case and MDY in the latter case (Figure 2). I believe SPY’s lackluster performance, not only in Q2 but also in 2015, is associated with the bias divergence in monetary policy at big central banks around the world whose effects I have discussed ad nauseam at Seeking Alpha, most recently in “NYSE Margin Debt Remains Near All-Time High In May: Risk Rank At No. 53.” Figure 3: Changes In Share Prices Of Five Key ETFs In June (click to enlarge) Source: This J.J.’s Risky Business chart is based on analyses of adjusted closing daily share prices at Yahoo Finance. Greece’s failure to make its payment to the International Monetary Fund Tuesday was preceded by a protracted period of silly shilly-shallying uncommon even by the standards of the eurozone, which is really saying something. The headline risk clearly had an impact on the U.S. stock market, with the beatdown victimizing larger caps more than smaller caps (Figure 3). This disparity in outcomes makes sense because the S&P 500 index firms that provided the data required to paint a complete picture of their global sales in 2012 indicated they booked 53.4 percent of their sales inside the U.S. and 46.6 percent of their sales outside the U.S., as discussed elsewhere . The comparable numbers for S&P 600 index firms the same year were 61.0 percent and 39.0 percent, in that order. As a result, SPY is more exposed to conditions around the world than is IJR. Figure 4: SPY Monthly Change, 2015 Vs. 1994-2014 Mean (click to enlarge) Source: This J.J.’s Risky Business chart is based on analyses of adjusted closing monthly share prices at Yahoo Finance . SPY behaved a lot worse in the first half of 2015 than it did during the comparable periods in its initial 21 full years of existence based on the monthly means calculated by employing data associated with that historical time frame (Figure 4). The same data set shows the average year’s strongest quarter was the fourth, with an absolutely large positive return, and its weakest quarter was the third, with an absolutely small positive return. Figure 5: SPY Monthly Change, 2015 Vs. 1994-2014 Median (click to enlarge) Source: This J.J.’s Risky Business chart is based on analyses of adjusted closing monthly share prices at Yahoo Finance. SPY also performed a lot worse in the first half of 2015 than it did during the comparable periods in its initial 21 full years of existence based on the monthly medians calculated by using data associated with that historical time frame (Figure 5). The same data set shows the average year’s strongest quarter was the fourth, with an absolutely large positive return, and its weakest quarter was the third, with an absolutely small positive return. Disclaimer: The opinions expressed herein by the author do not constitute an investment recommendation, and they are unsuitable for employment in the making of investment decisions. The opinions expressed herein address only certain aspects of potential investment in any securities and cannot substitute for comprehensive investment analysis. The opinions expressed herein are based on an incomplete set of information, illustrative in nature, and limited in scope. In addition, the opinions expressed herein reflect the author’s best judgment as of the date of publication, and they are subject to change without notice. Disclosure: I/we have no positions in any stocks mentioned, and no plans to initiate any positions within the next 72 hours. (More…) I wrote this article myself, and it expresses my own opinions. I am not receiving compensation for it (other than from Seeking Alpha). I have no business relationship with any company whose stock is mentioned in this article.