Tag Archives: stocks
Up 25% In 2 Weeks, I’m Out Of My Short Volatility Trade
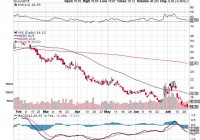
I recommended shorting VXX two weeks ago at the height of the Greece situation. That trade is up about 25% in two weeks as VXX is making new lows. Contango is still high so shorting VXX will still be profitable but I’m ringing the register here. A couple of weeks ago I wrote an article about the short term volatility ETF VXX (NYSEARCA: VXX ) during the height of the nonsense coming out of Greece. At the time panic levels were elevated and the VXX had climbed nicely from $17 to $21+ and the VIX term structure was nearly flat in the near months. That, combined with what I was quite sure was a situation that would be resolved peacefully by the EU, led me to believe VXX was expensive at $21.51 and I said investors should short it from that level. If we fast forward to today that proved to be the near exact top in VXX and we now see it making new lows once more. That trade worked out very nicely but what do we do now? (click to enlarge) The spike in VXX was pretty easy to call because the situation in Greece was blown way out of proportion. It is events like this that I love because people panic and provide us with very easy opportunities to make 20%+ gains in a matter of a few trading days by shorting VXX into these types of things. But now that it is over and the VIX has tanked once more, I think more caution is warranted in trading VXX. The easy spike in the VIX that allows us to take advantage of short opportunities in VXX is gone but contango in the VIX term structure is still very high as out months are elevated compared to the front month. This chart from vixcentral.com shows us that while the VIX spike premium is out of VXX there is still a lot of contango in the term structure so VXX will decay pretty quickly at these levels. This chart puts a magnitude on the contango as you can see the cost of holding VXX is very high right now. That means you’ll see sizable gains over time shorting VXX but the potential for huge short term gains is gone. I like to short VXX when it spikes and contango evaporates because that is a highly unsustainable position as you can see from this chart. At this point we just have negative roll yield and while that’s a powerful force in shorting VXX, it is a medium term story and not a matter of a couple of days. As a result, I’m ringing the register here. My short VXX trade is up ~25% in a couple of weeks and while contango is very high and there is still money to be made shorting VXX, I’m content to take my gains and move on. I’m not calling a bottom in VXX because the bottom continues to go lower but I am saying the easy money has been made. I’ll short VXX again at some point in the future but simply collecting the roll yield when the market looks like it might be topping is too risky for me. Disclosure: I/we have no positions in any stocks mentioned, and no plans to initiate any positions within the next 72 hours. (More…) I wrote this article myself, and it expresses my own opinions. I am not receiving compensation for it (other than from Seeking Alpha). I have no business relationship with any company whose stock is mentioned in this article. Share this article with a colleague
Market Timing With Value And Momentum
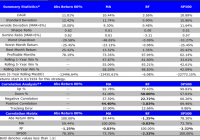
By Jack Vogel, Ph.D. Yesterday, we wrote a post showing a potential way to time the market using valuation-based signals. In the past, we have also examined how to use momentum-based signals (moving average rules and time-series momentum) to time the market. A natural question is, what happens when we combine the valuation-based signals with the momentum-based signals? Here at Alpha Architect, we are big believers in Value and Momentum . We have written about how to combine Value and Momentum in the security selection process here and here . In this post, we examine what happens when we combine valuation-based (value) signals with momentum-based (MA rule) signals. Here is the setup, from yesterday’s post: Strategy Background: We use 1/CAPE as the valuation metric, or the “earnings yield,” as a baseline indicator; however, we adjust the yield value for the realized year-over-year (yoy) inflation rate by subtracting the year-over-year inflation rate from the rate of 1/CAPE. To summarize, the metric looks as follows if the CAPE ratio is 20 and realized inflation (Inf) is 3%: Real Yield Spread Metric = (1/20)-3% = 2% Some details: The Bureau of Labor Statistics (BLS) publishes the CPI on a monthly basis since 1913; however, the data is one-month lagged (possibly longer). For example, the CPI for January won’t be released until February. So when we subtract the year-over-year inflation rate from the rate of 1/CAPE, we do 1-month lag to avoid look-ahead bias. We use the S&P 500 Total Return index as a buy-and-hold benchmark. So the two signals we will use are the following: Valuation-based signal: 80th Percentile Valuation-based asset allocation: Own the S&P 500 when valuation < 80th percentile, otherwise hold risk-free. In other word, if last month's CAPE valuation is in the 80 percentile or higher (data starting 1/1924), buy U.S. Treasury bills (Rf); otherwise stay in the market. Momentum-based signal: Long-term moving average rule on the S&P 500 (Own the S&P 500 if above the 12-month MA, risk-free if below the 12-month MA). The results are gross of any fees. All returns are total returns, and include the reinvestment of distributions (e.g., dividends). Indexes are unmanaged, do not reflect management or trading fees, and one cannot invest directly in an index. Our backtest period is from 1/1/1934 to 12/31/2014. Baseline Results: Here we show the results for 4 portfolios: Valuation-based market timing: Own the S&P 500 when valuation < 80th percentile, otherwise hold risk-free. Momentum-based market timing: Own the S&P 500 if above the 12-month MA, risk-free if below the 12-month MA. Risk-free: Total return to owning U.S. Treasury bills. SP500: Total return to the S&P 500. (click to enlarge) The results are hypothetical, are NOT an indicator of future results, and do NOT represent returns that any investor actually attained. Indexes are unmanaged, do not reflect management or trading fees, and one cannot invest directly in an index. Additional information regarding the construction of these results is available upon request. As previously noted, both Valuation and Momentum-based timing models increase Sharpe and Sortino ratios, while decreasing drawdowns. Now, let's combine them. Combining Value and Momentum Timing models: Here we show the results for 4 portfolios: (50/50) Abs 80%, MA : Each month, allocate 50% of capital to the valuation-based timing model and 50% or capital to the momentum-based allocation model. (and) Abs 80%, MA: Each month, examine the valuation and momentum-based signals. If both say "yes" to being in the market, invest in the S&P 500; if either or both say "no" to being in the market, invest in risk-free. (or) Abs 80%, MA: Each month, examine the valuation and momentum-based signals. If either says "yes" to being in the market, invest in the S&P 500; if both say "no" to being in the market, invest in risk-free. SP500: Total return to the S&P 500. (click to enlarge) The results are hypothetical, are NOT an indicator of future results, and do NOT represent returns that any investor actually attained. Indexes are unmanaged, do not reflect management or trading fees, and one cannot invest directly in an index. Additional information regarding the construction of these results is available upon request. Takeaways: Combining the Value and Momentum-based signals makes sense when using the "50/50 model" and the "(or) model." Both of these have higher Sharpe and Sortino ratios compared to standalone value and momentum-based models. The "(and) model" does not work very well - you are out of the market too often. Conclusion: Of course, transaction costs and taxes (not shown in the results above) need to be considered. However, it appears that combing Value and Momentum in market timing is promising, and something we will examine more carefully in the future. Original Post