Scalper1 News
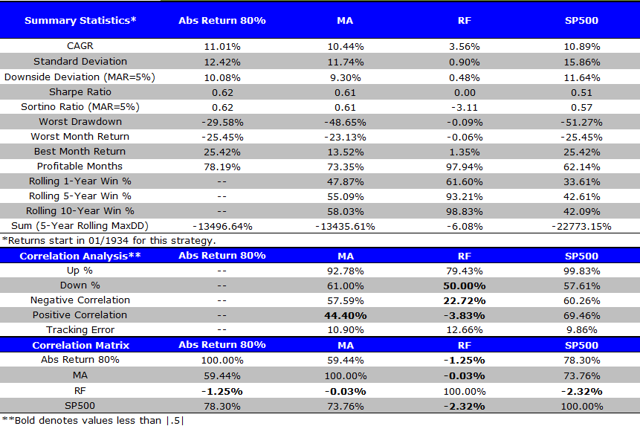
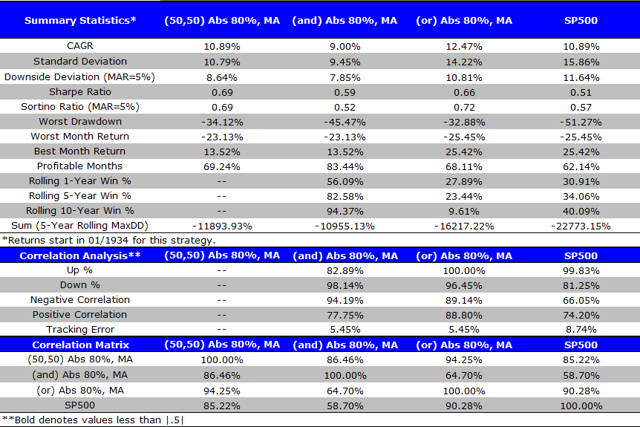 By Jack Vogel, Ph.D. Yesterday, we wrote a post showing a potential way to time the market using valuation-based signals. In the past, we have also examined how to use momentum-based signals (moving average rules and time-series momentum) to time the market. A natural question is, what happens when we combine the valuation-based signals with the momentum-based signals? Here at Alpha Architect, we are big believers in Value and Momentum . We have written about how to combine Value and Momentum in the security selection process here and here . In this post, we examine what happens when we combine valuation-based (value) signals with momentum-based (MA rule) signals. Here is the setup, from yesterday’s post: Strategy Background: We use 1/CAPE as the valuation metric, or the “earnings yield,” as a baseline indicator; however, we adjust the yield value for the realized year-over-year (yoy) inflation rate by subtracting the year-over-year inflation rate from the rate of 1/CAPE. To summarize, the metric looks as follows if the CAPE ratio is 20 and realized inflation (Inf) is 3%: Real Yield Spread Metric = (1/20)-3% = 2% Some details: The Bureau of Labor Statistics (BLS) publishes the CPI on a monthly basis since 1913; however, the data is one-month lagged (possibly longer). For example, the CPI for January won’t be released until February. So when we subtract the year-over-year inflation rate from the rate of 1/CAPE, we do 1-month lag to avoid look-ahead bias. We use the S&P 500 Total Return index as a buy-and-hold benchmark. So the two signals we will use are the following: Valuation-based signal: 80th Percentile Valuation-based asset allocation: Own the S&P 500 when valuation < 80th percentile, otherwise hold risk-free. In other word, if last month's CAPE valuation is in the 80 percentile or higher (data starting 1/1924), buy U.S. Treasury bills (Rf); otherwise stay in the market. Momentum-based signal: Long-term moving average rule on the S&P 500 (Own the S&P 500 if above the 12-month MA, risk-free if below the 12-month MA). The results are gross of any fees. All returns are total returns, and include the reinvestment of distributions (e.g., dividends). Indexes are unmanaged, do not reflect management or trading fees, and one cannot invest directly in an index. Our backtest period is from 1/1/1934 to 12/31/2014. Baseline Results: Here we show the results for 4 portfolios: Valuation-based market timing: Own the S&P 500 when valuation < 80th percentile, otherwise hold risk-free. Momentum-based market timing: Own the S&P 500 if above the 12-month MA, risk-free if below the 12-month MA. Risk-free: Total return to owning U.S. Treasury bills. SP500: Total return to the S&P 500. (click to enlarge) The results are hypothetical, are NOT an indicator of future results, and do NOT represent returns that any investor actually attained. Indexes are unmanaged, do not reflect management or trading fees, and one cannot invest directly in an index. Additional information regarding the construction of these results is available upon request. As previously noted, both Valuation and Momentum-based timing models increase Sharpe and Sortino ratios, while decreasing drawdowns. Now, let's combine them. Combining Value and Momentum Timing models: Here we show the results for 4 portfolios: (50/50) Abs 80%, MA : Each month, allocate 50% of capital to the valuation-based timing model and 50% or capital to the momentum-based allocation model. (and) Abs 80%, MA: Each month, examine the valuation and momentum-based signals. If both say "yes" to being in the market, invest in the S&P 500; if either or both say "no" to being in the market, invest in risk-free. (or) Abs 80%, MA: Each month, examine the valuation and momentum-based signals. If either says "yes" to being in the market, invest in the S&P 500; if both say "no" to being in the market, invest in risk-free. SP500: Total return to the S&P 500. (click to enlarge) The results are hypothetical, are NOT an indicator of future results, and do NOT represent returns that any investor actually attained. Indexes are unmanaged, do not reflect management or trading fees, and one cannot invest directly in an index. Additional information regarding the construction of these results is available upon request. Takeaways: Combining the Value and Momentum-based signals makes sense when using the "50/50 model" and the "(or) model." Both of these have higher Sharpe and Sortino ratios compared to standalone value and momentum-based models. The "(and) model" does not work very well - you are out of the market too often. Conclusion: Of course, transaction costs and taxes (not shown in the results above) need to be considered. However, it appears that combing Value and Momentum in market timing is promising, and something we will examine more carefully in the future. Original Post Scalper1 News
Scalper1 News