Freeport-McMoRan: A Lesson In Listening To The Model
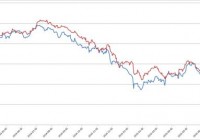
Summary After I designed a model that was surprisingly effective at predicting movements in Freeport-McMoRan, I stopped listening to it. The model was clearly predicting the latest crashes in Freeport-McMoRan. As bad as things are for Freeport-McMoRan, the commodities suggest current pricing is pretty fair. Freeport-McMoRan (NYSE: FCX ) has been in freefall for the last month or so. There have been great opportunities to get out, but I missed them because I was focused on doing analysis on other parts of the market. This is a story of the massive mistake I made and how easily it could have been prevented. Predicting Commodity Prices From the start, I’ve said that my goal is not to predict commodity prices because predicting which way the prices will move is not within my skill set. When I make investing decisions, I want to be functioning within my area of expertise. When it comes to Freeport-McMoRan my area of expertise was building a model that was vastly better at predicting returns than I could be relying on any other tool. Despite knowing that my area of expertise was in building the model, I allowed myself to be swamped with work and didn’t return to regularly run my model the way I did during my first stint investing in Freeport-McMoRan. How I Should Have Done It The best method for me would have been to write it into my schedule that at least every week I had to completely rerun my model and decide if the stock was worthy of investment at that point given the results. Unfortunately, I didn’t do that. I ran the model around June 7th, decided it was getting risky and posted my downgrade and intent to keep running the model and watching for strong indicators to get out. The proper choice, clearly, would have been to sell out immediately rather than looking to get a tiny bit of extra return relative to my index by holding the position. Let this be a lesson to all investors to keep a close eye on those volatile investments. At the same time, it would have been wise for me to make some improvements to make the model easier to update. That may have encouraged me to keep checking it every day rather than allowing my early summer days to become swamped with other activities. I’ve taken both of those lessons to heart. The saddest irony, as you’ll see, is that the spread widened further, precisely as I predicted over the next couple weeks. Part of that time was when I was out of the state and away from my model. Clearly, I should have closed out the position before I left. Getting Up to Date I reran my model which uses the opening values for shares of Freeport-McMoRan along with the opening values for different ETFs that track 4 of the 5 commodities Freeport-McMoRan produces. I use those ETFs to track the estimated price change in futures contracts on the commodities as a way of seeing where commodity prices are going. Occasionally Freeport-McMoRan will move before the futures prices on the commodities but a large divergence has been a clear sign that a correction is coming. In using those commodities I built my model to predict average annual EBITDA for FCX over the next couple of years and then set a standard deduction from that value to estimate the other necessary cost implications because interest, depreciation and amortization are very real costs. Taxes is also a real cost, but will generally scale in such a way that it is automatically accounted for in my model. That should sound very complex to readers that didn’t see my previous work on Freeport-McMoRan, but the charts are easy enough to read. The chart below shows the values for EBITDA minus the static. As you can see, the lines show a very strong connection. (click to enlarge) While I like that method for looking at the correlation over the long term, I prefer to actually read the output using bar charts. The following chart shows the values for the last seven months: (click to enlarge) I designed these charts using the opening values for each ticker. We don’t have the opening value for Monday, so I inserted the closing prices for Friday, July 24th as “July 25th”. As you can see, over the last couple months the shares have fallen significantly but not by near as much as the expected earnings. Contrary to popular belief, Freeport-McMoRan stock was actually holding up well if we compare it to the fundamental earning power of the company. You may notice the left side of the chart is done in percentage terms. I standardized all the values in that chart based off the values from the start of 2014. There is no reason to think that the values from the start of 2014 were perfectly aligned, but it made it possible to reliably get both bars onto the same scale to compare relative strength. Relative Strength I put together another chart that makes it even easier to read. This chart standardizes based off percentage change from the values on May 20th. (click to enlarge) Had I been disciplined enough to force myself to update the spreadsheet more regularly, I would have been out without a problem. I’m providing an even larger version of the very clear “Get the **** out” signal: By the middle of June the model was sending off extremely strong sell signals. When I tried to do an eyeball test of the movement by simply looking at price charts in early July, I thought the commodities were moving before Freeport-McMoRan and started to doubt my model. If I had updated it completely, I would have seen that Freeport-McMoRan was simply catching up with the losses the model was predicting and I would’ve got the heck out. What Does It All Mean for Freeport-McMoRan? Based on my model, the closing values put us fairly close to fairly priced. That makes decisions to buy or sell fairly neutral. The biggest concern on buying is that the volatility is enormous. I’ll be putting in some work to make the model easier for me to update and then I’ll be watching for another one of those clear buying or selling signals. At the moment the model is quite neutral since the red line is only mildly taller than the blue. This wasn’t a case of my model failing me, it was me failing the model and paying dearly for it. I designed my system around having an index of ETFs that I could use as my benchmark. This is the same batch of ETFs that I use in estimating EBITDA based off commodity futures contracts. Relative to the benchmark, I’m “winning”. The benchmark is down 52.4% and FCX is down 48.4%. Somehow, this doesn’t feel like winning. Disclosure: I am/we are long FCX. (More…) I wrote this article myself, and it expresses my own opinions. I am not receiving compensation for it (other than from Seeking Alpha). I have no business relationship with any company whose stock is mentioned in this article. Additional disclosure: Information in this article represents the opinion of the analyst. All statements are represented as opinions, rather than facts, and should not be construed as advice to buy or sell a security. Ratings of “outperform” and “underperform” reflect the analyst’s estimation of a divergence between the market value for a security and the price that would be appropriate given the potential for risks and returns relative to other securities. The analyst does not know your particular objectives for returns or constraints upon investing. All investors are encouraged to do their own research before making any investment decision. Information is regularly obtained from Yahoo Finance, Google Finance, and SEC Database. If Yahoo, Google, or the SEC database contained faulty or old information it could be incorporated into my analysis.