The Beginner’s Guide To Volatility: XIV
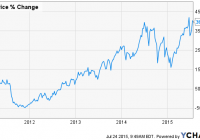
Summary We will cover the basics of XIV. How the performance of VIX futures dictates XIV value. Equitable advice for how to trade XIV. Welcome to part two of: The Beginners Guide to Volatility. These articles are built to serve as educational tools for you to gain a proper understanding of volatility ETFs before you invest in them. For part one: The Beginners Guide to Volatility: VXX, click here . In part one, we discussed pro-volatility products that benefit from increasing volatility and are hurt over the long term from the effects of contango. You may be wondering where that money goes. The answer is inverse volatility products. These instruments bet on decreasing volatility and are aided over time by the effects of contango. As the basis for discussion, we will use the most popular (currently by AUM) inverse ETN, the VelocityShares Daily Inverse VIX Short-Term ETN (NASDAQ: XIV ). There is some debate on the ETN vs. ETF factor and which one is ultimately better when compared to the ProShares Short VIX Short-Term Futures ETF (NYSEARCA: SVXY ). If you look at the long-term chart for both XIV and SVXY, they have near identical returns. SVXY does produce a K-1 tax form , which is a pain. SVXY trades options and XIV does not. I personally like options and trading options bypasses the K-1 form because you never own the security (unless you assigned). Options are a different subject, and I have separate articles dedicated to them. If you are looking to simply buy and hold an inverse volatility product for a short period of time, then I would recommend using XIV. Let’s start by looking at the long-term chart of XIV: If you read part one of this series, then you already know how contango negatively affects pro-volatility products. It has the opposite effect on inverse volatility products. Short-term inverse volatility products sell second-month futures contracts and then hold them short for periods of around 30 days, afterwards the contract is purchased and the process repeats itself. See below for a visual: (click to enlarge) As long as futures are in contango, which is when the first month’s (front month) futures contract is cheaper than the second month’s contract, then XIV will profit. The only exception would be if futures rise a rate higher than that of the contango. Another way that XIV profits is from decreasing volatility. See below for another visual: (click to enlarge) Here is a chart of XIV over the same period of time: Common Misconceptions One misconception I see quite frequently is that anytime is a good time to buy these products. They are often touted as the best investments. This is false. The best time to buy these products is during periods of high volatility and when futures are in backwardation. Backwardation is the opposite of contango and will cause a loss of value in XIV over time. Economics should play a large role in your decision to purchase XIV during backwardation. Should economic conditions deteriorate, then you could be looking at steep losses. Since these products have inception dates in 2010 and 2011, respectively, there is a degree of uncertainty with how they will perform during periods of economic recession. We do know how XIV would have performed in 2011 when fears of a double dip recession and global growth fears weighed heavily on U.S. markets. Thanks to back testing, we are able to manufacture pricing data on VIX futures products from 2004 on. See below for the long-term back tested chart of XIV: (click to enlarge) Chart created by Nathan Buehler using historical data from The Intelligent Investor Blog . Only trading dates (Mon-Fri) were used, but Excel automatically includes Saturdays and Sundays in the axis. As you can see from the above chart, there are good times and bad times to invest in XIV. During periods of recession, you should expect XIV to lose around 90%+ of its value. More back testing is available on SVXY here . The other misconception, that goes along with any volatility futures products, is that XIV tracks the VIX. It does not track the VIX. The VIX Index is not investable. XIV tracks the VIX futures and the VIX futures trade independent of the market and level of stock prices. For more information on these misconceptions, please view part one of the series. Backwardation Backwardation is your number one risk for holding XIV over long periods of time. A simple rise and subsequent fall in volatility would make it relatively risk free. However, backwardation permanently removes value from inverse volatility products during these events. See below for a visual: (click to enlarge) Below is a chart of the price action in XIV during the same period of time: Even though futures traded lower on 12/18/14 than they did on 12/10/14, XIV experienced a loss of value of 2.88%. Again, this was due to the permanent value loss caused by contango. During 2008, it wasn’t just higher volatility that crippled XIV, it was the ultra-high level of backwardation that came with it. (click to enlarge) Chart created by Nathan Buehler using historical data from The Intelligent Investor Blog. Only trading dates (Mon-Fri) were used, but Excel automatically includes Saturdays and Sundays in the axis. Is it rigged? Those that trade inverse volatility products seem to have less notion that the vehicles they invest in are flawed or rigged. These complainers will often come out on the pro-volatility side when things aren’t going their way, which is almost all of the time. These same types of complainers should be expected if inverse volatility products also begin to perform poorly. Currently, we are experiencing very low volatility. Historically, this provides the least reward for the risks involved. It is easy to call something rigged when you don’t understand how it works and it performs differently than you want it to. Gambling and volatility trading go hand in hand for some people. If you fully know and understand the game, volatility trading performs exactly as intended. Conclusion Inverse volatility products produce above-average returns during periods of economic growth. However, the risks they carry during periods of economic retraction should be fully understood by the investor. XIV will benefit from the contango that drags on pro-volatility products. Rising volatility and backwardation are conditions that should be monitored closely when evaluating a position in XIV. Current advice We are currently experiencing low volatility in relation to historical norms. See below: Economics and market psychology ultimately drive the VIX. A great series I like to watch is Jeff Millers “Weighing the Week Ahead.” You can view Jeff’s profile here . As we spoke about before, backwardation and spikes in volatility create the best entry points for XIV. Futures are currently far from backwardation, and I would wait for a better risk/reward entry point. Please follow me here on Seeking Alpha for more tips, education, and news about volatility. Keep an eye out for the last article in this series where we look at mid-term futures products. Disclosure: I/we have no positions in any stocks mentioned, and no plans to initiate any positions within the next 72 hours. (More…) I wrote this article myself, and it expresses my own opinions. I am not receiving compensation for it (other than from Seeking Alpha). I have no business relationship with any company whose stock is mentioned in this article.