The Low Volatility Anomaly: Mid Caps
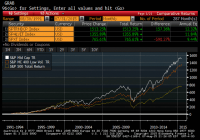
The Low Volatility Anomaly describes portfolios of lower volatility securities that have produced higher risk-adjusted returns than higher volatility securities historically. This article provides additional evidence for Low Volatility strategies by showing the factor’s success in mid-cap stocks. Provides historical comparison of returns between low volatility mid cap stocks versus broad mid cap indices and the benchmark large cap index. Thus far in this series, our most oft used description of the Low Volatility Anomaly in equity markets has been depicted through the use of a factor tilt on a large cap index. In the introductory article to this series on Low Volatility Investing, I plotted the cumulative total return profile (including reinvested dividends) of the S&P 500 (NYSEARCA: SPY ), the S&P 500 Low Volatility Index (NYSEARCA: SPLV ), and the S&P 500 High Beta Index (NYSEARCA: SPHB ) over the past twenty-five years. In an article last week , I showed that the Low Volatility Anomaly extends to small cap stocks as well as the S&P Smallcap 600 Low Volatility Index has also outperformed the broader S&P Smallcap 600 over the last twenty years, producing annual total returns of nearly 14% per annum. The volatility-tilted indices for both the small and large cap indices are comprised of the twenty percent of index constituents with the lowest (highest) volatility within the S&P 500 based on daily price variability over the trailing one year, rebalanced quarterly, and weighted by inverse (direct) volatility. The low volatility tilt of both the small and large cap indices produced both higher absolute returns and much lower variability of returns than the broader market gauges. This article will answer the question of whether such a factor tilt delivers alpha in the space in-between – the mid-cap stock market. Fortunately for our examination, Standard & Poor’s has also developed the S&P MidCap 400 Low Volatility Index . Similar to the S&P 500 Low Volatility Index, this benchmark tracks the twenty percent of the S&P MidCap 400 (eighty stocks) with the lowest realized volatility over the past year, weighted by an inverse of that volatility, and then rebalanced quarterly. While the index was launched in September 2012, Standard & Poor’s has back-tested data for over twenty years. Below is a graph of the cumulative total return of the S&P MidCap 400 Low Volatility Index, the S&P MidCap 400 Index, and the S&P 500. (click to enlarge) Source: Standard and Poor’s; Bloomberg As you can see above, the S&P MidCap 400 Index (white line; replicated through the ETF MDY ) readily bests the S&P 500 (yellow line). This outperformance is consistent with my article on 5 Ways to Beat the Market that demonstrated the structural alpha available through the size factor, which has been well documented in academic research (F ama & French, 1992 ). Some readers have also contended that the outperformance from Equal Weighting, which was also one of my “5 Ways ” is attributable to the size factor as well and more reminiscent of a mid-cap strategy given the lower average capitalization of equally weighting versus traditional capitalization weighting, but I contend that the contrarian re-balancing also contributes to the alpha-generative nature of that strategy. Whatever the source of the structural alpha, mid-caps have outperformed large-caps over long-time intervals. Low Volatility mid-caps have outperformed the broad mid-cap index on a risk-adjusted basis, but not on an absolute basis like the Small and Large Cap strategies. In tabular form, one can readily see that each of the small cap, mid cap, and large cap Low Volatility indices produce higher risk-adjusted returns with lower variability of returns than the broader market gauges from which they are constructed. The lower downside in the market selloff in 2008 greatly contributes to the lower variability of the Low Volatility indices. (click to enlarge) The PowerShares S&P MidCap Low Volatility Portfolio (NYSEARCA: XMLV ) seeks to replicate the performance of the S&P MidCap 400 Low Volatility Index with a 0.25% expense ratio. Like many of the Low Volatility ETFs, XMLV is a post-crisis innovation with a track record dating only back to February 2013. The ETF has only $100M of AUM, and thirty-day average volume of only 14,600 shares, similar AUM to the SmallCap Low Volatility ETF (NYSEARCA: XSLV ), but about 2/3 of the trading volume. Again similar to the Small Cap Low Volatility Index, I would be remiss if I did not mention that financials currently account for nearly half of the fund weighting (REITs 27.3%, Insurance 16.6%, Banks 3.8%). As I covered in a recent comparison between the PowerShares S&P Low Volatility ETF versus the iShares MSCI USA Minimum Volatility ETF (NYSEARCA: USMV ), industry concentrations in the S&P indices are uncapped, unlike the MSCI versions, and this lack of constraints has historically led to risk-adjusted outperformance and more variable industry concentrations over time. A reader of my article on Small Cap Low Volatility contended that they disfavored these funds because of the potential higher sensitivity to higher rates given the financial bent. Rates are moderately higher in 2015, and XMLV has delivered market-beating returns. I would point out that if higher rates lead to higher return volatility, then these stocks will be attributed lower weights or excluded from the fund at the quarterly rebalance date. As described in now fourteen recent articles on the Low Volatility Anomaly, I am a believer in the relative risk-adjusted outperformance of low volatility strategies. While Mid-Cap Low Volatility did not deliver the absolute outperformance versus the Mid Cap Index over the historical sample period, it still strongly outpeformed on a risk-adjusted basis. Versus the S&P 500, which many use as their benchmark, MidCap Low Volatility still delivered 3% per annum of outperformance with less than three-quarters of the return volatility. I am also a believer in the long-run outperformance available through the size factor that favors smaller and mid-capitalization stocks. Resultantly, I am evaluating an entry into a modest position to XMLV to provide some additional diversification to the Low Volatility portion of my long-term portfolio and will monitor the efficacy of this ETF vehicle as it matures. Disclaimer: My articles may contain statements and projections that are forward-looking in nature, and therefore inherently subject to numerous risks, uncertainties and assumptions. While my articles focus on generating long-term risk-adjusted returns, investment decisions necessarily involve the risk of loss of principal. Individual investor circumstances vary significantly, and information gleaned from my articles should be applied to your own unique investment situation, objectives, risk tolerance, and investment horizon Disclosure: I am/we are long SPY, SPLV, XSLV. (More…) I wrote this article myself, and it expresses my own opinions. I am not receiving compensation for it (other than from Seeking Alpha). I have no business relationship with any company whose stock is mentioned in this article.