Tag Archives: stocks

Investing Lessons From Baseball’s Active Managers

By James T. Tierney Jr., Chief Investment Officer – Concentrated US Growth As the popularity of passive investing continues to gain momentum, take pause to think about a lesson from baseball. The question is: what kind of equity lineup creates a winning team? Nobody can deny the increasing shift of equity investors toward index strategies. Net flows to passive US equity funds have reached $21.7 billion this year through June, while investors have pulled $83.7 billion out of actively managed portfolios, according to Morningstar. In this environment, active managers are increasingly challenged to prove their worth and justify their fees. Building a Winning Lineup Baseball provides an interesting analogy for the active equity manager. Across all players in Major League Baseball, the batting average this season is .253 , as of August 6. Yet even in today’s statistics driven environment, you won’t find a single team manager who would choose to put together a lineup of nine players who all bat .253-even if it were possible. The reason is clear and intuitive. For a baseball team to be successful, you need to have at least a few hitters who are likely to get hits more often than their peers. And to create a really robust lineup, a manager wants a couple of power hitters who pose a more potent threat. Of course, some hitters will trend toward the average and slumping players will hit well below the pack. That’s why you need a diverse bunch. A team comprised solely of .253 hitters is unlikely to have the energy or the momentum needed to win those crucial games and make the playoffs. False Security in Average Performance So what does this have to do with investing? When an investor allocates funds exclusively to passive portfolios, it’s like putting together an equity lineup that is uniformly composed of .253 hitters. This lineup might provide a sense of security because returns will always be in synch with the benchmark. But it’s little consolation if the benchmark slumps. A passive equity lineup won’t be able to rely on any higher-octane performers to pull it through challenging periods of lower, or negative, returns. Still, many investors fear getting stuck with a lineup of .200 hitting active managers. We believe the best strategy to combat that risk is to focus on investing with high conviction managers, who have a strong track record of beating the market, according to our research . Passive and Active: The Best of Both Worlds Passive investing has its merits. Investors have legitimate concerns about fees as well as the ability of active managers to deliver consistent outperformance. The appeal of passive is understandable. Yet we believe that putting an entire equity allocation in passive vehicles is flawed. It leaves investors exposed to potential concentration risks and bubbles that often infect the broader equity market. And with equity returns likely to be subdued in the coming years, beating the benchmark by even a percentage point or two will be increasingly important for investors seeking to benefit from compounding returns and meet their long-term goals. There is another way. By combining passive strategies with high-conviction equity portfolios, investors can enjoy the benefits of an index along with the diversity of performance from an active approach, in our view. Baseball managers don’t settle for average performance. Why should you? The views expressed herein do not constitute research, investment advice or trade recommendations and do not necessarily represent the views of all AB portfolio management teams.
My Favorite Ratios – Part 1

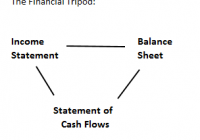
When the dog bites, when the bee stings, when I’m feeling sad, I simply remember my favorite things, and then I don’t feel so bad!” -The Sound of Music When Julie Andrews sings about bright copper kettles and whiskers on kittens, she’s trying to calm her charges during a violent thunderstorm. When the market gets turbulent and frightening, I turn to my favorite indicators of financial performance. I’ve noted before how – sooner or later – stock market performance has to come back to fundamentals. There has to be a way to evaluate how well a company is performing, whether it’s providing insurance or selling tractors. Most analysts use financial ratios. But there are literally hundreds of these, evaluating credit quality, efficiency, growth, even management’s language in their quarterly conference calls. Which ratios should we choose? I like to look at financial disclosures as a tripod, the three legs being the income statement, the balance sheet, and the statement of cash flows. The most basic analysis looks at earnings per share and (perhaps) sales as an indicator of how a firm is doing. But management sometimes manages those numbers. An investor once told of visiting a corporate loading dock on September 30th at lunch time. He asked the shipping manager how the quarter had gone. The manager looked at his watch and said he couldn’t tell, the quarter was only half over. Principal Financial Statements. Source: Douglas Tengdin But it’s hard to manipulate the entire financial picture. So I look at ratios that evaluate how these three principal disclosures interact. The most basic relationship is that between income and the balance sheet. This indicates how efficiently management is utilizing the assets that are under its control – how effective they are at turning an investor’s cash into earnings. So I use Return on Invested Capital – net earnings divided by the book value of equity and the market value of debt. I like to include debt in this analysis, because that doesn’t incent management to borrow money just to boost their return on equity. Second, I evaluate the ratio of cash from operations – part of the Statement of Cash Flows – to net income. This gives me, in broad terms, an indication of how much of the corporation’s earnings are based on cash receipts, versus accruals of one sort or another. Warren Buffett has said that cash is to a business as oxygen is to an individual. This relationship can give us a sense whether a company might need CPR soon. Finally, I examine the ratio of cash delivered to shareholders – both through dividends and net share buybacks – to the market value of equity. This ratio is the Shareholder Yield . This gives analysts a sense of how committed management is to returning cash to the company’s owners. We may be uncertain about many things that companies may disclose, but one thing we can be sure of is how much they pay us to hold their stock. And stock buybacks are important, as they can be a more tax-efficient way to return money to shareholders. Each of these numbers is independent of a company’s size. A mega-cap like GE (NYSE: GE ) with billions in capital is on the same footing as a 1000-person firm like Box. But taken together, they measure how efficiently a company is at generating cash from their businesses and how willing they are to send some of it to their investors. These indicators aren’t perfect. They are biased towards established companies that are in the process of paying shareholders – rather than taking in money and using it to grow, or even just redeploying their own internally-generated resources. And it’s important to look at footnotes as well, especially when accounting standards are changing. But when things go wrong, it’s comforting to know that a company’s management team is committed to distributing cash to me quarter after quarter. When a firm can do this from its own efficient operations, this can become an anchor of value in a storm of market turbulence. So, to paraphrase Maria (from The Sound of Music ), when the economy slows, when interest rates rise, when investors are feeling sad, I simply remember my favorite ratios, and – hopefully – my investments won’t do so bad.

Best S&P 500 Utility Stocks According To A Winning Ranking System: A Look At Exelon

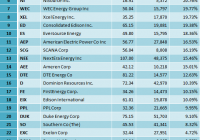
Summary Ranking the top twenty S&P 500 utility stocks according to a winning ranking system. Explanation and back-testing of the “ValueSheet” ranking system. Description and a buy recommendation for the first-ranked stock of the system: Exelon Corporation (EXC). S&P 500 utility stocks have given, on average, a similar return to that of the S&P 500 index over the last year. The average return of the 29 S&P 500 utility stocks that are included in the S&P 500 index (included dividends) in the last 52 weeks has been 10.51%, while the S&P 500 index has returned 9.77%. The table below shows all S&P 500 utility companies, ranked according to their 52 weeks return. A Ranking system sorts stocks from best to worst based on a set of weighted factors. Portfolio123 has a ranking system which allows the user to create complex formulas according to many different criteria. They also have highly useful several groups of pre-built ranking systems, I used one of them the “ValueSheet” in this article. The “ValueSheet” ranking system is quite complex, and it is taking into account many factors like; valuation ratios, growth rates, profitability ratios, financial strength, asset utilization, technical rank, industry rank, and industry leadership, as shown in Portfolio123’s chart below. In order to find out how such a ranking formula would have performed during the last 16 years, I ran a back-test, which is available by the Portfolio123’s screener. For the back-test, I took all the 6,651 stocks in the Portfolio123’s database. The back-test results are shown in the chart below. For the back-test, I divided the 6,651 companies into twenty groups according to their ranking. The chart clearly shows that the average annual return has a very significant positive correlation to the “ValueSheet” rank. The highest ranked group with the ranking score of 95-100, which is shown by the light blue column in the chart, has given by far the best return, an average annual return of about 18%, while the average annual return of the S&P 500 index during the same period was about 3.5% (the red column at the left part of the chart). Also, the second and the third group (scored: 90-95 and 85-90) have given superior returns. This brings me to the conclusion that the ranking system is very useful. After running the “ValueSheet” ranking system on all S&P 500 utility stocks on August 09, I discovered the twenty best stocks, which are shown in the table below. In this article, I will focus on the first-ranked stock; Exelon Corporation (NYSE: EXC ). (click to enlarge) On July 29, Exelon reported its second quarter 2015 results and narrowed its full-year operating earnings guidance to $2.35 to $2.55 per share. Exelon achieved earnings above its guidance range in the quarter, led by a strong financial performance at Constellation. The company beat EPS expectations in the last quarter by $0.05 (9.3%). The major drivers for the beat were reduced outages at ExGen’s nuclear plants and lower uncollectibles at Baltimore Gas & Electric. Revenue grew 5.1% to $6.51 billion in the period. Exelon showed earnings per share surprise in its last two-quarters after missing estimates in the previous quarter, as shown in the table below. Source: Yahoo Finance Despite low power prices and challenging market conditions in the wholesale power markets, I see healthy growth prospects for the company. The proposed all-cash acquisition, pending approvals, of Pepco (NYSE: POM ), will help to boost Exelon’s earnings growth rate. The merger continues to be conditioned upon approval by the Public Service Commission of the District of Columbia. Exelon expects the merger to be completed in the third quarter of 2015. On the regulated side, the forthcoming Pepco merger should bring opportunities for investment and operational improvement, as well as an additional regulated earnings stream to support the dividend. Also, the coming industry coal plant retirements will lower future reserve margins and would lead to higher electricity prices. In another development, the company plans, in September, to decide what nuclear plant will be retired due to uneconomic operational conditions. Exelon continues to evaluate the viability of three of its nuclear plants in Illinois (Byron, Quad Cities, and Clinton) given that the Illinois legislative session ended without a resolution on the low carbon portfolio. Valuation EXC’s stock has underperformed the market in the last few years. The stock is down 12.5% year-to-date while the S&P 500 index has increased 0.9%, and the Nasdaq Composite Index has gained 6.5%. Moreover, since the beginning of 2013, EXC’s stock has gained only 9.1% while the S&P 500 index has increased 45.7%, and the Nasdaq Composite Index has risen 67%. However, In my opinion, EXC’s stock is a clear value with the stock having faded more than its fundamentals and key catalysts. (click to enlarge) Chart: TradeStation Group, Inc. Exelon’s valuation metrics are excellent, the trailing P/E is very low at 11.97, the forward P/E is low at 13.40, and its price-to-sales ratio is also very low at 0.95. Furthermore, its Enterprise Value/EBITDA ratio is very low at 6.76, the lowest among all S&P 500 utility stocks. Source: Portfolio123 Exelon is paying a generous dividend. The forward annual dividend yield is pretty high at 3.82% and the payout ratio is at 45.8%. However, the annual rate of dividend growth over the past five years was negative at -10%. Summary Exelon delivered better than expected second quarter results and narrowed its full-year operating earnings guidance to $2.35 to $2.55 per share. Exelon achieved earnings above its guidance range in the quarter, led by a strong financial performance at Constellation. Despite low power prices and challenging market conditions in the wholesale power markets, I see healthy growth prospects for the company. The proposed all-cash acquisition, pending approvals, of Pepco, will help to boost Exelon’s earnings growth rate. Exelon has compelling valuation; its EV/EBITDA ratio of 6.76 is the lowest among all S&P 500 utility stocks. In my view, the recent retreat in its price offers an excellent opportunity to buy the stock at a cheap price. Disclosure: I/we have no positions in any stocks mentioned, and no plans to initiate any positions within the next 72 hours. (More…) I wrote this article myself, and it expresses my own opinions. I am not receiving compensation for it (other than from Seeking Alpha). I have no business relationship with any company whose stock is mentioned in this article.