Tag Archives: stocks

Consumer Discretionary And Mid Cap: 2 ETFs To Watch On Outsized Volume

In the last trading session, U.S. stocks fell following solid job gains in July, which has increased the chances of the Fed pulling its trigger on the first rate hike in almost a decade. Among the top ETFs, investors saw the SPDR S&P 500 Trust ETF (NYSEARCA: SPY ) lose 0.2%, the SPDR Dow Jones Industrial Average ETF (NYSEARCA: DIA ) shed 0.2% and the PowerShares QQQ Trust ETF (NASDAQ: QQQ ) move lower by 0.1% on the day. Two more specialized ETFs are worth noting, as both saw trading volume that was far outside of normal. In fact, for the most recent trading session, both these funds experienced volume levels that were more than double their average. This could make these ETFs ones to watch out for in the days ahead to see if this trend of extra interest continues: Vanguard Consumer Discretionary ETF (NYSEARCA: VCR ): Volume 3.18 times average This consumer discretionary ETF was in focus yesterday, as more than 387,000 shares moved hands, compared to an average of roughly 126,000. We also saw some share price movement, as VCR lost 0.1% in the past session. The big move was largely the result of solid July job numbers that indicate stepped-up momentum in the U.S. economy. VCR was up nearly 2.1% in the month, and currently has a Zacks ETF Rank of #2 (Buy). It may an interesting option for longer-term investors. Vanguard Mid Cap ETF (NYSEARCA: VO ): Volume 2.79 times average This mid-cap ETF was under the microscope yesterday, as nearly 776,000 shares moved hands. This compares to an average trading day of 291,000 shares, and came as VO lost nearly 0.1% on the session. The movement can largely be blamed on the growing concerns over interest rates hike and the resultant stronger greenback that can have a huge impact on mid-cap stocks like what we find in this ETF’s portfolio. VO was up nearly 1.2% in the past month, and currently has a Zacks ETF Rank of #3 (Hold). Original Post Share this article with a colleague

Bring Data

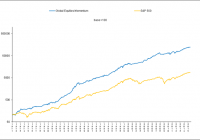
When doing financial modeling, one of the first things to look at is if your empirical work makes sense. In other words, are there valid economic reasons why a model should work? This can help you avoid drawing erroneous conclusions based on creative data mining. [1] Next, you should look for robustness. This can take several forms. One of the most common robustness tests is to see how well a model does when it is applied to somewhat different markets. Even though equities have historically offered the highest risk premium, it is desirable to see a model do well when it is also applied to other financial markets. Another robustness test is to see if a model is consistent over time. You do not want to see success based on spurious short periods of good fortune. Similarly, you would like to see a model hold up well over a range of parameter values. Getting lucky can be good in some things, but not in financial research. Relative and absolute momentum have held up well according to all of the above criteria. But now that momentum is attracting more attention, it is important to remain vigilant and to keep robustness in mind. What makes this especially true is the natural tendency to come up with modifications and “enhancements” that can add complexity to a once-simple model. An interesting new paper by Dietvorst, Simmons, and Massey (2015) called ” Overcoming Algorithm Aversion: People Will Use Algorithms if They Can (Even Slightly) Modify Them ,” shows that people are considerably more likely to adopt a model if they can modify it. Everyone likes to feel that they have some personal involvement with a model, and that they may have made it better. But simpler is often better in the long run. Data-mined “enhancements” may fit the existing data well, but may not hold up on new data or over longer periods of time. I have seen dozens of variations and “enhancements” to momentum, and I will undoubtedly see many more in the days ahead. One variation that attracted considerable attention a few years ago was by Novy-Marx (2012), who found that the first six months of the lookback period for individual stocks gave higher profits than the more recent six months. This became known as the “echo effect.” However, it never made much sense to me. So I tested the echo effect on stock indices, stock sectors, and assets other than stocks. I was not surprised when incorporating the echo effect gave worse results than the normal way of calculating momentum. A subsequent study by Goyal and Wahal (2013) showed that the echo effect was invalid in 37 markets outside the U.S. Goyal and Wahal also demonstrated that the echo effect was largely driven by short-term reversals stemming from the second to the last month. Overreaction to news leading to short-term mean reversion of individual stocks does make sense. Prior to that time, only the last month was routinely skipped when calculating momentum for stocks. [2] Based on this finding, the latest research papers skip the prior two months instead of just the last month when calculating individual stock momentum. [3] While robustness tests are very important, the best validation of a trading model is to see how it performs on additional out-of-sample data. The statistician W. Edwards Deming once said, “In God we trust; everyone else bring data.” When I first developed the dual momentum-based Global Equities Momentum (GEM) model, my backtest went to January 1974. This is because the Barclays Capital bond index data I was using began in January 1973. I am now able to access Ibbotson bond index data, which has a much longer history. My GEM constraint has now changed to the MSCI stock index data going back to January 1970. Having this additional bond data, I have another three years of out-of-sample performance for GEM. My new backtest includes the 1973-74 bear market, and shows dual momentum sidestepping the carnage of another severe bear market. (click to enlarge) GEM is more attractive than it was previously on both an absolute basis and relative to common benchmarks. Here is summary performance information from January 1971 through July 2015. 60/40 is 60% S&P 500 and 40% Barclays Capital U.S. Aggregate Bonds (prior to January 1976, Ibbotson U.S. Government Intermediate Bonds). Monthly returns (updated each month) can be found on the Performance page of our website. GEM S&P 500 60/40 Ann Rtn 18.2 11.9 10.2 Std Dev 12.5 15.2 9.8 Sharpe 0.91 0.38 0.44 Max DD -17.8 -50.9 -32.5 Results are hypothetical, are NOT an indicator of future results, and do NOT represent returns that any investor actually attained. Indexes are unmanaged, do not reflect management or trading fees, and one cannot invest directly in an index. Please see our GEM Performance and Disclaimer pages for more information. In our next article, we will look at longer out-of-sample performance using the world’s longest backtests. Fortunately for us, these were done to further validate simple relative and absolute momentum. [1] For example, between 1978 and 2008, U.S. stocks had an annual return of 13.9% when a U.S. model was on the cover of the annual Sports Illustrated swimsuit issue versus 7.2% when a non-U.S. model was on the cover. [2] Short-term mean reversion is not an issue with stock indices or other asset classes, so the last two months do not need to be excluded from their momentum lookback period. [3] See Geczy and Samonov (2015). The discovery of two-month mean reversion is an example of the Fleming effect in which different but related research can lead to serendipitous results.

Rate Hike Fears Spark 2015’s Biggest Bond Fund Outflow

According to the latest data from the Investment Company Institute, U.S.-based bond funds witnessed the biggest outflows in 2015. The year’s biggest outflow was attributed to the increasing fears about the possibility of the first rate hike in September. For the week ending July 29, $4.7 billion was pulled out of the US bond funds. This was the biggest weekly outflow since mid December and also reversed the $1.6 billion of inflows in the prior week. Certain dismal economic data, such as the decline in ISM manufacturing index and weak wage growth data, have negated the Fed rate hike possibilities momentarily. Nonetheless, the balance towards the possibilities of rate hike is stronger, which is further evident from the bond fund outflows. The primary forms of bond risk include default risk and the interest rate risk. A low interest rate environment is favorable for investments in bond funds. This stems from the fact that the market value of a bond is inversely proportional to interest rates. Government bond prices usually move up when yields drop along with lower interest rates. Outcome of Latest FOMC Meeting The Federal Open Market Committee’s two-day policy meeting gave no clear indication on the timing of the first rate hike. However, the door for a September rate hike was kept open. The policy makers said: “The labor market continued to improve, with solid job gains and declining unemployment”. The committee also said that “economic activity has been expanding moderately in recent months” and that there has been “moderate” improvement in consumer spending levels along with an “additional improvement” in the housing market. These comments did raise speculations of a possible rate hike in September or at the most in December. However, the committee also mentioned “inflation continued to run below the Committee’s longer-run objective.” The central bank’s inflation target is 2%. The Fed remained dovish about economic health, which increased September rate hike possibilities. The Federal Reserve Chairwoman Janet Yellen stated that the U.S. economy will strengthen and expects the central bank to hike interest rates “at some point this year.” Fed Officials Signal Hike in September In an interview with The Wall Street Journal, Atlanta Fed Reserve president Dennis Lockhart signaled that the Fed is preparing for a rate hike in September. He said that the given economic scenario is “appropriate” to opt for a rate hike in near future unless the economy witnesses a “significant deterioration”. He stated: “I think there is a high bar right now to not acting, speaking for myself… My priors going into the (September) meeting as of today are that the economy is ready and it is an appropriate time to make a change.” Last month, San Francisco Fed President John Williams said that a rate hike could take place as soon as September. Williams believes that inflation will soon increase to the Fed’s target rate of 2%. There was a high probability that it could go even higher by the end of next year. Williams added that full employment could be achieved even before the end of 2016. His views are of particular significance since he is a voting member of the Fed’s decision-making body. Additionally, he takes a moderate stance on such issues, consistent with the position of the current Fed Chair. Previously, New York Fed President William Dudley had said a rate hike would be “very much in play” during the Fed’s September meeting. Dudley added that this was, of course, associated with continuing evidence that the economy was continuing to recover. International Bond Funds as Alternative? As the Fed hikes interest rates, a sell-off in bond funds is likely to take place as investors switch to safer choices. Some experts have even suggested that investors should move out of such securities as soon as the rate hike takes place. The influential Carl Icahn also expressed similar views. He said the junk bond market was “extremely overheated.” However, for investors interested in the space, there are actually some alternatives they can try. International bond funds are great alternatives, as they are one of the best ways to balance losses incurred from US markets, since interest rate fluctuations differ from country to country. Considered to be among the world’s largest asset classes, international bond funds show little correlation with domestic equities and only moderate correlation with investment grade domestic debt. They also help in diversifying currency exposure and protecting assets against a long-term secular decline in the U.S. dollar. Below we present 3 international bond – developed mutual funds that carry either a Zacks Mutual Fund Rank #1 (Strong Buy) and Zacks Mutual Fund Rank #2 (Buy). Goldman Sachs High Yield Floating Rate A (MUTF: GFRAX ) seeks high current income. GFRAX invests a lion’s share of its assets in domestic or foreign floating rate loans and other floating or variable rate obligations that are rated below investment grade. GFRAX may invest a maximum of 20% of its assets in fixed income instruments regardless of their ratings. These may comprise fixed rate corporate bonds, government bonds and convertible debt obligations among others. GFRAX currently carries a Zacks Mutual Fund Rank #1 (Strong Buy). The year-to-date and 1-year returns are 1.9% and 1.7%. The 3-year annualized return is 3.2%. The expense ratio of 0.94% is lower than the category average of 1.11%. Payden Global Fixed Income (MUTF: PYGFX ) invests in varied debt instruments and income-producing securities. A minimum of 65% of assets is invested in investment grade debt securities. A maximum of 35% of assets may be invested in junk bonds. However, the overall average credit quality of the fund will be investment grade. PYGFX currently carries a Zacks Mutual Fund Rank #1 (Strong Buy). The year-to-date and 1-year returns are 1.5% and 3.9%. The 3-year and 5-year annualized returns are 3.6% and 4%. The expense ratio of 0.7% is lower than the category average of 1.03%. Eaton Vance Global Macro Absolute Return A (MUTF: EAGMX ) invests in securities and derivatives among other instruments to gain short and long investment exposures across the globe. The short and long investments are sovereign exposures, which include currencies, interest rates and debt instruments. EAGMX invests in many countries and has significant exposure to foreign currencies. EAGMX currently carries a Zacks Mutual Fund Rank #1 (Strong Buy). The year-to-date and 1-year returns are 1.7% and 3.1%. The 3-year annualized return is 1.8%. The expense ratio of 1.05% is lower than the category average of 1.28%. Original Post