Tag Archives: setpageviewname

Is Targa Resources The Next Energy Sector Takeover Candidate?

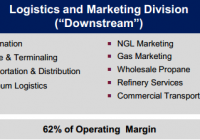
Summary In the current low energy price environment, strong companies are looking for assets or companies they can take over on the cheap. Targa Resources Corp. is the general partner of a quality MLP that has suffered with lower energy commodity prices. TRGP is down 35% even as dividend increased 6% every quarter. Several large cap energy midstream companies could start a bidding war for TRGP. A 30% premium on the current share price is not out of the question. The steep declines in the energy commodity prices have led to speculation about mergers or acquisitions in the sector. I primarily follow the MLP and related companies, and so far in 2015, acquisition activity has been light. Vanguard Natural Resources LLC (NASDAQ: VNR ) has agreed to acquire a couple of smaller upstream MLPs and Enterprise Product Partners LP (NYSE: EPD ) just announced a $2.1 billion private deal acquisition of gathering and processing assets. Outside of these I can’t think of any meaningful purchases. I think that Targa Resources Corp. (NYSE: TRGP ) could be ripe for a take over offer from an energy midstream company looking to add quality assets and a historically successful midstream operation. Targa Overview Targa Resources Corp. owns the general partner interest and 9.1% of the LP units of Targa Resources Partners LP (NYSE: NGLS ) a $7.9 billion market cap midstream MLP. NGLS generates about 40% of its operating margin from gathering services in Texas and Oklahoma and the balance comes from logistics and marketing, which includes the following services: Targa Resources Corp. has used the GP incentives growth model to produce a high level of dividend growth compared to the NGLS distribution growth rate. If you are not familiar with the GP growth potential, I covered how the partnership system works in this article . Over the last three years the TRGP dividend has increased 27% up to 35% year over year every quarter. This growth in the TRGP dividend was fueled by high single digit distribution growth at the MLP level. Targa Resource Partners has aggressively developed and acquired midstream assets. The company has invested over $2 billion in organic capex since 2012, bringing $1 billion worth of projects online in each of the last two years. In addition, over $8 billion in acquisitions have closed over the last three years. In February Targa Resources closed its acquisition of Atlas Pipeline Partners, LP and Atlas Energy, LP. Commodity Price Declines Slow DCF Growth In the current slower drilling and lower energy price environment, Targa Resources Partners most recent guidance is for 4% to 7% distribution growth in 2015 with 1.0 times distributable cash flow coverage. In 2014 the NGLS distribution grew by 8% on 1.5 times DCF coverage. The Targa Resources Corp dividend guidance for 2015 is 25% growth, compared to 27% growth in 2014. The market has noticed the significant drop in DCF coverage at the MLP level, pushing down the NGLS and TRGP share prices by 30% and 35% respectively since last September. In 2015, the TRGP share price has cycled a couple of times between about $90 and $107. In the last 6 weeks the price has dropped from the $107 cycle peak to currently trade around $90. Reasons for the decline seem to be around falling energy commodity prices and the failure of TRGP to announce some sort of MLP roll up plan similar to the recent Kinder Morgan Inc. (NYSE: KMI ) and Williams Companies (NYSE: WMB ) moves. See: Income Power Couple: Stacking Kinder Morgan Against Williams Companies The steep share price decline has pushed the TRGP yield up to 3.6%, well above the low 2% yield the company carried last year and the 2% to 2.5% rate the market current puts on 25% high visibility dividend growth. It seems that the market does not believe that this year’s growth guidance will be met and prospects have slowed for Targa Resource Partners in the longer term. Potential Acquirers In spite of the current downturn in values, the Targa Resources companies have a high quality book of assets and operations. The company’s gathering assets are in the heart of the Permian basin and the processing, storage and export assets are in prime locations on the Gulf Coast. To acquire these assets would be a boost to one of several large cap midstream companies. If a company buys up TRGP as the general partner, the MLP is then controlled, to be merged with other assets or left as a stand alone partnership. Here are a couple of large cap MLPs that would benefit from the acquisition of Targa Resources Corp and have the resources to make a $6 billion or higher bid for the company. Enterprise Product Partners : With its $60 billion market cap, EPD needs to make meaningful acquisitions to move the needle. The Targa assets would dovetail in nicely with the Enterprise holdings. EPD made a similar acquisition last year by first buying the privately held Oiltanking GP interests and then later making an offer for the publicly traded Oiltanking LP units. Williams Companies likes to view itself as one of the major natural gas infrastructure players. Acquiring Targa would be similar to last year’s absorption of Access Midstream Partners. Williams first picked up all of the Access GP ownership and then merged the MLP into Williams Partners. Energy Transfer Equity LP (NYSE: ETE ) : The Energy Transfer group has been a more of build by acquisition set of businesses. Last year they made a run at Targa, but nothing came of it. I would not surprise me if Energy Transfer made another offer for the company. If one of the listed companies made an offer for TRGP, it would not be a surprise to see a bidding war break out. An offer of $120 per share might be enough to obtain the company. Disclosure: The author is long TRGP, KMI, WMB. (More…) The author wrote this article themselves, and it expresses their own opinions. The author is not receiving compensation for it (other than from Seeking Alpha). The author has no business relationship with any company whose stock is mentioned in this article.

Estimating Worst Case SWRs For Modern Portfolios

One of the challenges in dealing with modern portfolios like the Permanent Portfolio, the various IVY portfolios, Risk Parity portfolios, etc is the lack of long term historical data. Most of the modern portfolio data for a broad range of asset classes only goes back to 1973. The period from 1973 onward obviously only represents a subset of historical economic and financial conditions. This represents quite a challenge when looking forward and trying to model probable future outcomes for different portfolios. In the context of retirement this fact makes determining SWRs for modern portfolios difficult. The worst case historical 30 year retirement period that determines the SWR for the 60/40 US stock US bond portfolio began in 1966 . Fortunately, 1966 is not that far from 1973 which gave me an idea for estimating SWRs for modern portfolios as if they existed from 1966. Just use the 60/40 return data to for the modern portfolios from 1966 to 1972, then the modern portfolio return data going forward to estimate an SWR for these portfolios. This should give a conservative estimate for historical SWRs form these portfolios which is an apples to apples comparison to the SWR from the classic 60/40 portfolio, aka the famous 4% rule. Let’s see where this process takes us. In previous posts I had presented a variety of statistics for modern portfolios; returns, standard deviations, and SWRs. I also pointed out that the SWRs from these calculations had to be taken with a huge grain of salt. The retirement periods from 1973 onward, when the data for the modern portfolios begins, do not encompass the worst case period in history to retire, the 30 year period starting in 1966. The SWRs for periods starting in 1973 would be significantly higher than for those starting in 1966. In order to get an estimate of what SWRs for modern portfolios would have been going back to 1966 I simply took the historical return series for each of the modern portfolios and used the return data from the 60/40 portfolio from 1966 to 1972 for each portfolio. This will yield a conservative estimate of the modern portfolio SWRs going back to 1996. The assumption here of course is that the modern portfolios would have performed better than the 60/40 portfolios from 1966 to 1972. I think that’s a pretty safe assumption. Below is a table of the results along with the other portfolios stats that I updated through 2014. I did not do this exercise for all the portfolios I track just the ones I discuss the most often on the blog. First, all the portfolio stats in the table are for the period from 1973 to 2014, the actual performance of the portfolios. It is only for estimating the SWRs that I inserted the 1966 to 1972 60/40 return data. I labeled that line 1966 SWRs to make that distinction. As the 1966 SWR line shows, even with the initial 7 year (1966 to 1972) equal performance to the 6o/40 portfolio all of modern portfolios have significantly higher SWRs than the classic 60/40 or even 70/30 US stock US bond buy and hold portfolio. The more broadly diversified buy and hold portfolios, IVY B&H 5, IBY B&H 13, and the Permanent Portfolios have estimated 1966 SWRs ranging from 5.06% to 5.76%. The portfolios that add simple downside risk management (via the 10 month SMA) – the GTAA5 and GTAA 13 portfolios have 1966 SWRs of 5.36% and 6.13% respectively. GTAA 13 also adds value and momentum factors to the mix. Then the portfolios that have diversification, downside risk management, value and dual momentum factors have the highest 1966 SWRs of all. The Antonacci dual momentum portfolios, GEM and GBM, have 1966 SWRs of 5.71% and 5.68%. The aggressive IVY momentum portfolios, AGG6 and AGG3 lead the bunch with SWRs of 7.95% and 8.63% respectively. Pretty impressive all the way around even after handicapping the modern portfolios with 60/40 returns from 1966 to 1972. In summary, modern portfolios have significantly higher SWRs than the classic 4% SWR rule suggests. Even in the forecasted poor return scenarios that I’ve discussed before these portfolios will most likely perform much better than the classic portfolio that the original 4% SWR was based on. Does that mean that these estimated historical SWRs can be used for investors starting to withdraw from portfolios today? Possibly but I wouldn’t go so far as that. As the infamous disclaimer goes, past returns are no guarantee of the future. All we can do is put the odds in our favor. Being the conservative sort, I base my investment allocations on one or more of these modern portfolios but still stick the 4% SWR rule. Then I adjust SWRs accordingly maybe every 3-5 years. Regardless, the superior nature of the modern portfolios, not just in terms of SWRs, should be considered by all investors. Note: There is a lot of information about modern portfolios to glean from all of the portfolio stats in the above table for investors withdrawing from portfolios and even of investors still in the wealth building phase. Just look at the differences in returns/risk and long term wealth for these modern portfolios vs the most often recommended 60/40 buy and hold portfolio. The fact that the 60/40 portfolio is still the most common allocation for US investors is kind of crazy when you see these results.

The Lesson From PXMC: Investors Shouldn’t Rely On Average Trading Volume

Summary I’m taking a look at PXMC as a candidate for inclusion in my ETF portfolio. Looking at the liquidity by the average trading volume is misleading in this case. Looking at number of days where no shares traded hands provides a different picture. I like the ETF for being intelligently designed, but I can’t accept the combination of expense ratios and poor liquidity. Investors should be seeking to improve their risk-adjusted returns. I’m a big fan of using ETFs to achieve the risk-adjusted returns relative to the portfolios that a normal investor can generate for themselves after trading costs. I’m working on building a new portfolio and I’m going to be analyzing several of the ETFs that I am considering for my personal portfolio. One of the funds that I’m considering is the PowerShares Fundamental Pure Mid Core Portfolio ETF (NYSEARCA: PXMC ). I’ll be performing a substantial portion of my analysis along the lines of modern portfolio theory, so my goal is to find ways to minimize costs while achieving diversification to reduce my risk level. What does PXMC do? PXMC uses an indexing approach to track the performance of the RAFI® Fundamental Mid Core Index. The ETF falls under the category of “Mid-Cap Blend.” Does PXMC provide diversification benefits to a portfolio? Each investor may hold a different portfolio, but I use SPDR S&P 500 Trust ETF (NYSEARCA: SPY ) as the basis for my analysis. I believe SPY, or another large cap U.S. fund with similar properties, represents the reasonable first step for many investors designing an ETF portfolio. Therefore, I start my diversification analysis by seeing how it works with SPY. I start with an ANOVA table: (click to enlarge) The correlation measured on a daily basis is beautiful at just over 76%. I want to see low correlations, and that is exactly what I’m finding in PXMC. However, the reliability of that correlation depends on the liquidity of the ETF. If shares aren’t trading hands, no change in price is recorded, and it appears that the value was steady even if the net asset value was changing in correlation with SPY. Standard deviation of daily returns (dividend adjusted, measured since January 2012) The standard deviation is mediocre. For PXMC it is .818%. For SPY, it is 0.736% for the same period. SPY usually has a lower level of standard deviation than other ETFs, so being a little bit above SPY isn’t too bad. With the low correlation, the ETF could still do fairly well under Modern Portfolio Theory. Why I use standard deviation of daily returns I don’t believe historical returns have predictive power for future returns, but I do believe historical values for standard deviations of returns relative to other ETFs have some predictive power on future risks and correlations. Liquidity is inconsistent The average trading volume can change dramatically depending on when investors look at it. Unfortunately, the volume can spike quite substantially. Over the 3 year time period, the average trading volume is under 1,500 shares per day. However, there are also days where over 40,000 shares change hands. In my opinion, this is a fairly dangerous liquidity situation for investors. Yield The distribution yield is 1.26%. For such an illiquid ETF, a higher distribution yield would be fairly nice for investors that were seeking to see some income from their position. The poor liquidity doesn’t bode well for investors that have to sell portions of their position to generate income. Expense Ratio The ETF has a net expense ratio of .39% and a gross expense ratio of .69%. The net expense ratio isn’t too bad, as long as it doesn’t eventually change to reflect the gross expense ratio. Market to NAV The ETF is at a .08% premium to NAV currently. When I first looked at the ETF a few weeks ago, it was trading at a .05% discount to NAV. A price swing of .13% in a few weeks wouldn’t bother me at all, but I am concerned when the discount or premium to NAV can swing that way. It reinforces my concerns about liquidity. I wouldn’t feel comfortable trading on this unless I was very confident that I had up to the minute data on the NAV. Largest Holdings The diversification is pretty good in this ETF. (click to enlarge) Conclusion I haven’t found much luck in finding a mid-cap portfolio that really appeals to me. I would love for this to be the one, but I don’t trust the statistics after seeing the poor liquidity. The average trading volume would make investors believe it held some liquidity, if they happened to look shortly after one of the spikes in volume. However, the 71 days with 0 trading volume create a real concern for me. If those days were largely behind the ETF, I wouldn’t be willing to move past it as well. However, upon closer inspection only 47 of the days had occurred before January of 2014. The other 24 days had to occur within 2014. That’s a substantial portion of the trading days. The holdings have reasonable diversification and the performance hasn’t been bad. If I thought I could leverage the poor liquidity into a meaningful discount on an entry position, then I would find that quite appealing. However, with the volume being 0 on so many days I don’t think there are many sellers willing to cross a large spread and sell at a meaningful discount to NAV. I might find the ETF fairly appealing if I was able to immediately locate deviations from NAV in real time, but I’m not looking for that level of complexity in entering a position. In a year or two, I may be looking to experiment in that realm and I would definitely consider this ETF again at that point. On the other hand, if the ETF’s liquidity improved, I would find that very appealing and would want to take another look at the ETF and test the correlation again without so many days with a volume of 0. The PowerShares portfolios I have looked at recently have had higher expense ratios, but the selection of securities seemed to be intelligent and the performance history has held up. I like those factors and would consider handling poor liquidity or a high expense ratio, but not both. Disclosure: The author has no positions in any stocks mentioned, and no plans to initiate any positions within the next 72 hours. (More…) The author wrote this article themselves, and it expresses their own opinions. The author is not receiving compensation for it (other than from Seeking Alpha). The author has no business relationship with any company whose stock is mentioned in this article. Additional disclosure: Information in this article represents the opinion of the analyst. All statements are represented as opinions, rather than facts, and should not be construed as advice to buy or sell a security. Ratings of “outperform” and “underperform” reflect the analyst’s estimation of a divergence between the market value for a security and the price that would be appropriate given the potential for risks and returns relative to other securities. The analyst does not know your particular objectives for returns or constraints upon investing. All investors are encouraged to do their own research before making any investment decision. Information is regularly obtained from Yahoo Finance, Google Finance, and SEC Database. If Yahoo, Google, or the SEC database contained faulty or old information it could be incorporated into my analysis. The analyst holds a diversified portfolio including mutual funds or index funds which may include a small long exposure to the stock.