Tag Archives: setpageviewname

SPY’s 2015 2nd-Quarter Performance And Seasonality

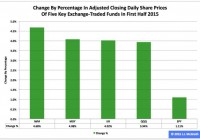
Summary The SPDR S&P 500 ETF in the first half ranked No. 3 among the three most popular exchange-traded funds based on the S&P Composite 1500’s constituent indexes. In the second quarter, the ETF’s adjusted closing daily share price advanced by a rather small 0.22 percent. In June, the fund’s share price declined by a rather large -2.01 percent. The SPDR S&P 500 ETF (NYSEARCA: SPY ) during 2015’s first half was third by return among the three most popular ETFs based on the S&P Composite 1500’s constituent indexes, which encompass the SPDR S&P MidCap 400 ETF (NYSEARCA: MDY ) and the iShares Core S&P Small-Cap ETF (NYSEARCA: IJR ). SPY edged higher to $205.89 from $203.64, an increase of $2.25, or 1.11 percent, but it behaved worse than MDY by -2.98 percentage points and IJR by -2.91 percentage points. Figure 1: Change In Share Prices Of Five Key ETFs In First Half (click to enlarge) Source: This J.J.’s Risky Business chart is based on analyses of adjusted closing daily share prices at Yahoo Finance . Market day in and market day out, I analyze in multiple ways 13 ETFs through my Risky Business Daily Market Seismometer : These funds are SPY, MDY and IJR, as well as the nine Select Sector SPDRs and the small-capitalization iShares Russell 2000 ETF (NYSEARCA: IWM ). I also assess the large-cap (and technology-dominated) PowerShares QQQ (NASDAQ: QQQ ), albeit on a comparatively infrequent basis. Thanks to this monitoring, I anticipate being shocked by market events on occasion, but I do not expect being surprised by them. Anyway, SPY in the first half of the year was the worst performer among the five key ETFs I employ to evaluate equity classes by market cap (Figure 1). Figure 2: Change In Share Prices Of Five Key ETFs In Second Quarter (click to enlarge) Source: This J.J.’s Risky Business chart is based on analyses of adjusted closing daily share prices at Yahoo Finance. SPY was neither the best behaved nor the worst behaved of my five key ETFs last quarter, as these distinctions were claimed by QQQ in the former case and MDY in the latter case (Figure 2). I believe SPY’s lackluster performance, not only in Q2 but also in 2015, is associated with the bias divergence in monetary policy at big central banks around the world whose effects I have discussed ad nauseam at Seeking Alpha, most recently in “NYSE Margin Debt Remains Near All-Time High In May: Risk Rank At No. 53.” Figure 3: Changes In Share Prices Of Five Key ETFs In June (click to enlarge) Source: This J.J.’s Risky Business chart is based on analyses of adjusted closing daily share prices at Yahoo Finance. Greece’s failure to make its payment to the International Monetary Fund Tuesday was preceded by a protracted period of silly shilly-shallying uncommon even by the standards of the eurozone, which is really saying something. The headline risk clearly had an impact on the U.S. stock market, with the beatdown victimizing larger caps more than smaller caps (Figure 3). This disparity in outcomes makes sense because the S&P 500 index firms that provided the data required to paint a complete picture of their global sales in 2012 indicated they booked 53.4 percent of their sales inside the U.S. and 46.6 percent of their sales outside the U.S., as discussed elsewhere . The comparable numbers for S&P 600 index firms the same year were 61.0 percent and 39.0 percent, in that order. As a result, SPY is more exposed to conditions around the world than is IJR. Figure 4: SPY Monthly Change, 2015 Vs. 1994-2014 Mean (click to enlarge) Source: This J.J.’s Risky Business chart is based on analyses of adjusted closing monthly share prices at Yahoo Finance . SPY behaved a lot worse in the first half of 2015 than it did during the comparable periods in its initial 21 full years of existence based on the monthly means calculated by employing data associated with that historical time frame (Figure 4). The same data set shows the average year’s strongest quarter was the fourth, with an absolutely large positive return, and its weakest quarter was the third, with an absolutely small positive return. Figure 5: SPY Monthly Change, 2015 Vs. 1994-2014 Median (click to enlarge) Source: This J.J.’s Risky Business chart is based on analyses of adjusted closing monthly share prices at Yahoo Finance. SPY also performed a lot worse in the first half of 2015 than it did during the comparable periods in its initial 21 full years of existence based on the monthly medians calculated by using data associated with that historical time frame (Figure 5). The same data set shows the average year’s strongest quarter was the fourth, with an absolutely large positive return, and its weakest quarter was the third, with an absolutely small positive return. Disclaimer: The opinions expressed herein by the author do not constitute an investment recommendation, and they are unsuitable for employment in the making of investment decisions. The opinions expressed herein address only certain aspects of potential investment in any securities and cannot substitute for comprehensive investment analysis. The opinions expressed herein are based on an incomplete set of information, illustrative in nature, and limited in scope. In addition, the opinions expressed herein reflect the author’s best judgment as of the date of publication, and they are subject to change without notice. Disclosure: I/we have no positions in any stocks mentioned, and no plans to initiate any positions within the next 72 hours. (More…) I wrote this article myself, and it expresses my own opinions. I am not receiving compensation for it (other than from Seeking Alpha). I have no business relationship with any company whose stock is mentioned in this article.
5 Aggressive Growth Mutual Funds To Buy For High Growth

When capital appreciation over the long term takes precedence over dividend payouts, growth funds become a natural choice for investors. However, investors looking for highest capital gains should look no further than investing in aggressive growth mutual funds. These funds invest in companies that show high growth prospects, but that comes with the risk of share price fluctuations. This category of funds also invests heavily in undervalued stocks, IPOs and relatively volatile securities in order to profit from them in a congenial economic climate. Securities are selected on the basis of their issuing company’s potential for growth and profitability. Below we will share with you 5 buy-rated Aggressive Growth mutual funds. Each has earned a Zacks Mutual Fund Rank #1 (Strong Buy) or Zacks Mutual Fund Rank #2 (Buy) as we expect these mutual funds to outperform their peers in the future. Hartford Growth Opportunities Fund A (MUTF: HGOAX ) invests in a broad range of common stocks from diversified industries and companies that the sub-adviser considers to have superior growth prospects. HGOAX focuses on mid to large cap stocks and a maximum of 25% may be invested in non-US issuers and non-dollar securities. HGOAX has a three-year annualized return of 21.6%. Hartford Growth Opportunities A has an expense ratio of 1.15% compared to a category average of 1.19%. Fidelity Growth Strategies (MUTF: FDEGX ) seeks capital appreciation. FDEGX invests primarily in common stocks of domestic and foreign issuers that the management believes offer potential for accelerated earnings or revenue growth. FDEGX focuses on investments in medium-sized companies, but it may also invest substantially in larger or smaller companies. FDEGX has a three-year annualized return of 21.1%. As of May 2015, FDEGX held 123 issues, with 2.41% of its total assets invested in Avago Technologies (NASDAQ: AVGO ) PrimeCap Odyssey Aggressive Growth (MUTF: POAGX ) invests in U.S. companies having rapid earnings growth potential. Though POAGX invests across market sectors and market caps, it has historically invested most of its assets in mid to small cap firms. This high yield mutual fund has a three-year annualized return of 8.7%. POAGX has a three-year annualized return of 25.3%. Theo A. Kolokotrones is the fund manager and has managed this fund since 2004. Vantagepoint Aggressive Opportunities Fund (MUTF: VPAOX ) seeks capital growth over the long term. It invests using an actively managed strategy in stocks of small to mid cap domestic and foreign firms, which are believed to have high capital growth prospects. The fund also invests in stocks listed in a custom version of the Russell Midcap Growth Index. VPAOX has a three-year annualized return of 25.3%. Vantagepoint Aggressive Opportunities Investor has an expense ratio of 0.83% compared to a category average of 1.30%. ClearBridge Aggressive Growth Fund A (MUTF: SHRAX ) seek capital appreciation. SHRAX invests in companies that the manager believes are growing or will improve earnings at a faster rate than companies included in the S&P 500 Index. SHRAX invests a significant portion of its assets in small and medium-sized companies. SHRAX has a three-year annualized return of 21.9%. As of June 2015, SHRAX held 71 issues, with 9.3% of its total assets invested in Biogen Inc. (NASDAQ: BIIB ) Original Post

5 American ETFs Enjoying Independence

A marked growth in the U.S. economy has increased the confidence in its people. Yet the U.S. stock market is caught in a bull-bear tug of war this year. This is especially true as the S&P 500 recorded its worst performance in five years, gaining just 0.2% in the first half. Meanwhile, Dow Jones shed over 1% in the same time period. A massive decline thanks solely to the Greece crisis spoilt the market mood in the final days of the first half. The debt drama in Greece climaxed after the deal talk collapsed last weekend, forcing prime minister Alexis Tsipras to close the country’s banks and impose capital controls. Further, rounds of downbeat economic data, strong dollar, global economic slowdown concerns, and the prospect of higher interest rates kept the stock prices at check. Yet in such a sluggish backdrop, some specific zones like small caps, health care, technology and many others shone. The financial sector too is pinning all hopes on the likely interest rates hike later this year. In fact, the tech-heavy Nasdaq Composite Index and the small cap Russell 2000 Index have been on a tear, having returned respectively 5.3% and 4.1%. Nasdaq has been blessed this year. It crossed the 5,000 milestone for the first time in early March since the 2000 dot-com bubble and touched multiple highs at regular intervals. Robust performances were driven by growing demand for novel and advanced technologies, and better job prospects. Economically sensitive sectors like technology generally pick up in an expanding economic cycle and most of the tech companies are sitting on a huge pile of cash, which ensures their strength in the rising rate environment. On the other hand, small caps ensure higher returns when the American economy is arguably leading the way. These pint-sized stocks are closely tied to the U.S. economy and generate most of their revenues from the domestic market, making them safer bets than their large and mid cap counterparts during a global turmoil. Due to their less international exposure, these stocks remained relatively unscathed by the strong dollar and Grexit fears. Given this, we have highlighted five star-spangled ETFs with handsome returns of at least 10% in the first six months of 2015. These funds focus exclusively on American equities and could definitely be worth a look for investors seeking a domestic tilt to their portfolio following the Fourth of July Holiday. Also, these are free from external threats, and move independently from the major indices: ALPS Medical Breakthroughs ETF (NYSEARCA: SBIO ) This fund targets companies with one or more drugs in Phase II or Phase III FDA clinical trials by tracking the Poliwogg Medical Breakthroughs Index. It provides a well spread out exposure to 82 stocks in its basket with none holding more than 4.50% share. SBIO is a small cap centric fund, having amassed $124.7 million in its asset base since its debut six months ago. The product charges 50 bps in fees per year from investors and trades in average daily volume of around 78,000 shares. It has delivered excellent returns of about 38% in the first half driven by its dual nature – small cap exposure and non-cyclical sector. Aging population, Obamacare, an endless hunt for new drugs, merger mania and cost cutting efforts added to the further strength. Barclays Return on Disability ETN (NYSEARCA: RODI ) This product is also the new entrant in the space, having debuted last September. It provides exposure to the companies that have acted to attract and serve people with disabilities and their friends and family as customers and employees. The fund follows the Return on Disability US LargeCap ETN Total Return USD Index, which measures the 100 largest companies that are outperforming in the disability market. The note charges 45 bps in annual fees from investors and trades in a meager volume of under 1,000 shares. The ETN was up over 26% in the same timeframe. ARK Web x.0 ETF (NYSEARCA: ARKW ) This is an actively managed fund focusing on companies that are expected to benefit from the shift of technology infrastructure from hardware and software to cloud enabling mobile and local services. These companies will primarily be either developers or users in fields such as cloud computing, wearable technology, big data, cryptocurrencies, social media, services and data mining, Internet of Things and digital education. The fund holds 45 stocks in its basket with a tilt toward the top firm – Athenahealth (NASDAQ: ATHN ) – at 7% while other firms hold less than 5% share. It has amassed $11.4 million in its asset base within less than a year while sees average daily volume of around 2,000 shares. Expense ratio came in at 0.95%. The fund has added over 12% in the first six months of this year. Guggenheim S&P SmallCap 600 Pure Growth ETF (NYSEARCA: RZG ) This fund targets the small cap U.S. market and follows the S&P SmallCap 600 Pure Growth Index. Holding 133 securities in its basket, it is well spread out across components with each holding less than 2.2%. Health care, financials, consumer discretionary, information technology, and industrials are top five sectors with double-digit allocation each. The fund has amassed $182.8 million in its asset base while trades in light volume of about 18,000 shares a day on average. It charges 35 bps in fees per year from investors and gained nearly 12% in the same time period. PowerShares KBW Regional Banking Portfolio ETF (NYSEARCA: KBWR ) This fund offers exposure to the regional banking corner of the broad financial market. It tracks the KBW Regional Banking Index and holds 50 stocks in its basket. The product is widely diversified across components with none accounting more than 4.01% share. It is a small cap centric fund as these account for 79% of the portfolio while the rest goes to mid caps. The ETF is often overlooked by investors as depicted by its AUM of $41.5 million and average daily volume of under 6,000 shares. It charges 35 bps in annual fees and added nearly 11% in the first half of 2015. Original Post