Tag Archives: send-xhr-start

A Top-Ranked India ETF To Tap The Growing Consumer Sector

The Indian stock market has hardly looked back from the astounding journey it set forth on in May 2014 following the formation of the new government. Most economic factors are presently in favor of Asia’s third-largest economy, including the revival of the currency, a drastic fall in inflation thanks mainly to the oil price crash and an improvement in current account deficit. India’s wholesale price inflation – which was an acute concern leading to a series of rate hikes in the past couple of years – plunged to a five-year low in September. Though India’s Q3 GDP growth rate of 5.3% was not great, analysts from HSBC expect over 6% growth rate from this nation next year. This is noteworthy since the nation’s bourses suffered a lot last year as foreign investors remained skittish about putting more capital in the nation, leaving many questions about the potential of the country in the near term. Actually, given that India isn’t a commodity-oriented emerging market like its BRIC brothers Brazil or Russia, the nation has immensely benefited from the recent natural resource weakness. If this is not enough, Credit Suisse forecasts that Indian economy will log ‘fastest USD nominal growth in the world’ next year as noted by Reuters. To add to this, Credit Suisse believes that Indian equities are not pricey relative to the nation’s growth outlook. This recent bullish tone did spread cheers across every corner of the Indian economy as evident by at least a 25% return received from each India ETF this year. However, some specific corners need special mention. One such space is the Indian consumer sector. What Drives Consumer Sector Higher? The middle income population in India is mushrooming. This fraction of the population has an inclination to spend on discretionary items like travel and leisure which in turn boosts the sales of consumer products like automobiles and personal goods. For example, auto sales displayed a speedy annual expansion of 10% in November (yoy). Notably, auto sales are often regarded as a well-being of an economy. Lower fuel prices seemed to have done the trick. Moreover, with cooling inflation, many are speculating a rate cut in the coming days, though no such thing has taken place formally as of yet. And if in any case, the interest rate goes down, the auto industry should soar. India basically has a compelling investment proposition with its rising importance as a ‘consumer driven’ economy. As per Indian Brand Equity Foundation (IBEF), the present consumer spending will likely grow two-fold by 2025. The consumer confidence score rose to 126 in Q3 of this year from an all-time low of 92 reached in Q1 of 2010. The market is motivated by favorable demographics and expanding disposable income. IBEF also predicts that per capita income in India will likely see a meaningful CAGR of 5.4% within the span of 2010-2019 with food products and personal care taking about 65% share of the market revenue. Other forecasts by IBEF include doubling of the consumer durables market by FY15 from FY10. The young generation’s inclination toward tech-driven products will also facilitate this growth trajectory. This calls for a bullish stance over the consumer sector of the Indian economy. Here we would like to highlight the Zacks top-ranked ETF providing exposure to this very corner of the Indian market. EGShares India Consumer ETF ( INCO ) has a Zacks ETF Rank #1 (strong Buy) with a Medium risk outlook and we expect it to outperform most of its peers in the coming months meaning it could be an excellent pick for investors seeking more exposure to this economy. INCO in Focus This ETF targets the consumer industry of India and follows the Indxx India Consumer Index. It holds 30 stocks in its basket and has amassed $21.5 million in its asset base. The fund trades in a paltry volume of 15,000 shares, suggesting additional cost in the form of wide bid/ask spread beyond the expense ratio of 0.89%. The fund offers a moderately concentrated bet in the top 10 holdings as indicated by its 52% exposure to these stocks. Among individual holdings, MRF Ltd., Motherson Sumi Systems Ltd. and Bosch Ltd form the top positions of the fund with total investment of 17.7%. The fund allocates 79.42% of its asset base to consumer goods. A small proportion of the asset base has also been assigned to Industrials (15.4%) and Consumer Services (4.8%). Industry-wise, automobiles – which is presently a well-performing sector in India – accounts for 37.5% followed by personal goods (27.14%) and industrial engineering (15.4%). INCO has hit a low of $19.64 and a 52-week high of $34.89. The fund is currently hovering near its 52-week high price and could be an interesting choice in 2015 for investors seeking more Indian market exposure.
Why Paying Up For Quality Isn’t Such A Bad Thing

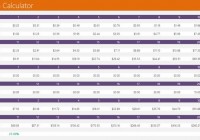
Summary As investors, our investment philosophy is closely aligned with our personality. My personality is that I like quality. Buying a basket of cheap stocks and selling them when they reach intrinsic value works. It just doesn’t work for me. Over 20 years, the stock price went from $7.50 to $260.21. That’s an annualized return of 20.52% and a cumulative return of 3370%! I’m a pretty cheap guy. But I think you have to pay up to enjoy the finer things in life. It’s nice to find great bargains. If you can buy a dollar for 50 cents, then why not? I’m a big fan of Ben Graham and the traditional value investing approach. I bought some stocks with this approach and did pretty well. However, this doesn’t exactly align with my personality. Investment Philosophy and Personality As investors, our investment philosophy is closely aligned with our personality. My personality is that I like quality. I like to buy great assets similar to how I like to collect rare video games. I know that you have to pay a little bit for quality. Sometimes you get good quality at a great price, but sometimes you get good quality at a reasonable price, which is okay too. I don’t like the idea of owning a company and hoping for the PE or book value to go up. The company is not doing so well, it’s not growing, nor creating any shareholder wealth. But it’s dirt cheap! And I hope that at some point the market will reappraise the business, it’s going to be bought out, management will do something to create value, etc. I’m a patient guy, but I don’t like the thought of depending on the kindness of others. You’re basically trying to find a higher price buyer for the same asset. A Company That Creates Wealth I like the idea of partnering with someone that’s really building a company. I’m attracted to the prospect that a company’s earnings will increase 500% over say 10 years. The fact that you made a good investment because the company has done very well is something that makes sense to me. I just have a different personality than the traditional value investor. I enjoy reading shareholder letters where management discusses the company’s many accomplishments and goals. You can read previous letters and track the progress. It’s really amazing to see a business creating wealth over time simply by reading the letters. Buying a basket of cheap stocks and selling them when they reach intrinsic value works. It just doesn’t work for me. I discovered that I like it better when I find a company I can own for 10 years and I do well not because the market does some kind of reappraisal of the business, but because the business has created wealth. But you know, that’s me. And I know the danger of paying too much for a great business so I try to be cautious on that too. With that said, let’s see how much we should pay up for quality. Time For Some Math My background is in engineering. I designed solar panels for a tech start-up a while back, thought I was going to change the world, but came up just a bit short. Coming from an engineering background, I like seeing numbers to support any valid reasoning. There’s a saying, “In the short term the stock market is a voting machine, and it’s a weighing machine long term.” I believe that’s true. It’s hard for a stock to earn a much better return that the business which underlies it earns. A lot of folks are concerned about the price they paid for an investment. The price paid for an investment starts to diminish if a company can generate an attractive return on capital (ROC) and management does a good job of capital allocation. I know I know… enough about this return on capital stuff. But I think it’s really important. You can read my previous posts about ROC here and here . Let’s say we’re going to invest in two companies and hold them for 20 years. All earnings will be reinvested back into the business every year. After 20 years, both companies will trade at 15x earnings. Okay, the first business earns 25% ROC. We paid 30x earnings on day one. In 20 years, it’ll be trading at 15x earnings, that’s a multiple contraction of 50% over time. What earnings multiple of current earnings would we need to pay for a business earning 10% ROC to end up with an identical return? 10% ROC is roughly the average for most businesses, but I might be somewhat generous there. Think about it for a minute. I was like what the f$*% when I did the calculations. I think is might be the reason why Warren Buffett likes to buy and hold forever. Here are calculations for the first business earning 30% ROC. (click to enlarge) The first business earned $0.25 on $1.00 of capital. We’re paying 30x the $0.25 in earnings, or $7.50 per share. As you can see, the impact of compounding takes effect in a big way! In the 20th year, the first business earns $17.35, or 25%, on $69.39 per share in capital. At a multiple of 15x, the stock would be trading at $260.21 per share. Over 20 years, the stock price went from $7.50 to $260.21. That’s an annualized return of 20.52% and a cumulative return of 3370%! Not too shabby… Now let’s run the numbers for the second business earning 10% ROC. (click to enlarge) The second business earned $0.10 on $1.00 of capital. Assuming the stock trades at 15x for the $0.61 earnings in the 20th year, the market would pay $9.17 for this business. On day one, we would needed to pay $0.26 per share or about 2.65x earnings to match the returns generated by the first business, which we paid 30x earnings for. The multiple needed to expand from 2.65x to 15x, which is an increase of 467%. Conclusion It looks like paying up for quality isn’t such a bad thing after all. 30x earnings might seem like a high price at first, but as you can see the returns are pretty good over the long term. It all depends on how high your hurdle rate is. Mine is 15% annually. I try to achieve this by buying truly outstanding businesses at reasonable prices. A reasonable price for me is around 15-20x earnings, lower is always better of course. Luckily there aren’t many great businesses out there, which makes tracking them somewhat easier. I think I own some fantastic businesses. And there are more great businesses I’d love to own at the right price. So I watch them here and there. I guess the take away from all this is there’s serious money to be made by holding onto a truly outstanding business year after year after year. You just have to be patient. Would you pay up for quality? Click here to download the valuation calculator. Thanks for reading!

3 Thriving ETFs With Over 500% AUM Growth In 2014

The global ETF industry has grown rapidly this year hitting a record of $2.76 trillion at the end of November with 1,659 products from 68 providers on three exchanges, as per the data from ETFGI . It is on track to cross the $3 trillion milestone in the first half of 2015. The industry has gathered $275.3 billion in new capital since the start of the year through November, representing all-time high inflows and surpassing the prior full-year net inflows. About 72% ($1.98 trillion) of the total AUM came from the U.S. ETFs. In fact, November has been the strongest month in 2014 with net inflows of $42 billion. Equity products have been leading the way higher with net inflows of $38.8 billion, followed by $4.9 billion inflows in fixed income products last month. Commodity ETFs/ETPs were the laggards with $221 million of asset outflows. The U.S. ETF industry has hit the $2 trillion mark this week, accumulating $232 billion in new assets year-to-date buoyed by massive inflows into the equity products. It easily topped last-year record inflows of $188 billion. This is especially true as investors continue pouring their money into the equity ETFs on rising confidence in the U.S. economic growth, accelerating job market, renewed optimism in housing recovery, low interest rates, low energy prices, healthy corporate earnings, and a flurry of merger & acquisition activities. Further, the U.S. has enjoyed back-to-back quarters of strong growth not seen in more than a decade. The economy expanded at a solid clip of 3.9% annually in the third quarter, up from the initial estimate of 3.5%, and was preceded by 4.6% growth in the second quarter. The country is also on track for the strongest annual job growth since late 1999. This suggests that the U.S. has emerged as a stronger nation trumping global economic concerns and geopolitical threats of 2014. Moreover, the Fed’s latest dovish comment that it is not in a hurry to raise interest rates has propelled the U.S. stocks higher. As a result, a number of U.S. equity ETPs have seen over 500-fold increase this year. Below, we have highlighted some of those in detail: iPath S&P MLP ETN (NYSEARCA: IMLP ) MLP ETPs have gained immense popularity this year, primarily due to crumbling oil prices that have badly hurt the overall energy space. This is because MLPs have lower correlations to oil price and thrive in a low oil price environment, thereby having stable revenues. Beyond the stability, yields are also pretty high thanks to favorable tax rules that push firms in the MLP space to substantially pay out all of their income to investors on a regular basis. Further, these firms remain the major beneficiaries of the U.S. oil boom over the longer term. While most of the products in this space have substantially increased their sizes, IMLP emerged as the biggest winner. Its AUM surged to $775.9 million from about $52 million at the start of 2014. The ETN follows the S&P MLP Index and charges 80 bps in fees per year from investors. It sees good volume of about 147,000 shares per day on average and has added 4.2% so far this year (read: 3 Promising MLP ETFs Now on Sale ). VelocityShares Volatility Hedged Large Cap ETF (NYSEARCA: SPXH ) While 2014 is turning out as another banner year for the U.S. stock market, volatility has also been on the rise thanks to global economic slowdown concerns, geopolitical tensions, and lower oil prices. As a result, many investors have taken advantage of the rising volatility while protecting their long equity positions simultaneously by investing in volatility hedged equity ETFs. Investors should note that the space is not much crowded and most of the products gained greater traction this year. Out of these, SPXH has pulled in over $73 million in capital, propelling its total asset base to $83.3 million. The ETF tracks the VelocityShares Volatility Hedged Large Cap Index and looks to hedge “volatility risk” in the S&P 500, offering investors’ exposure to not only the S&P 500 but also both long and inverse exposure in short-term VIX futures (read: Hedge Volatility in Your Portfolio with These Alternative ETFs ). The product provides target equity exposure of 85% to the S&P 500 while the remaining 15% goes to the volatility strategy. It trades in a light volume of roughly 20,000 shares a day and charges 71 bps in annual fees. The ETF has gained nearly 8% this year. ProShares S&P 500 Aristocrats ETF (NYSEARCA: NOBL ) In the current ultra-low rate environment and amid global uncertainty, investors have become defensive and are seeking safe and stable investments. Dividend Aristocrats generally act as a hedge against economic uncertainty and provide downside protection by offering outsized payouts or sizable yields on a regular basis. In addition, aristocrats tend to skew the portfolio to less volatile sectors and mature companies (read: Guide to Dividend Aristocrat ETFs ). This fund has accumulated about 87% of the AUM as $428 million inflows this year shot up its total asset base to $490.3 million. Expense ratio is 0.35% while average daily volume is moderate at 78,000 shares. The product provides exposure to the companies that raised dividend payments annually for at least 25 years by tracking the S&P 500 Dividend Aristocrats. Holding 54 stocks in its basket, the fund is widely diversified across securities as each accounts for less than 2.2% share. Consumer staples dominates about one-fourth of the portfolio while industrials, consumer discretionary, and health care round off the next threes pots with double-digit exposure. NOBL surged about 16% on the year and has 30-day SEC yield of 1.84%. It has a Zacks ETF Rank of 1 or ‘Strong Buy’ rating with a Medium risk outlook.