Does Every Dog Have Its Day?
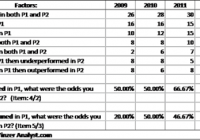
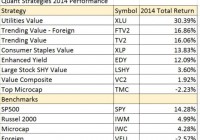
The Yinzer Analyst is a simple man; he likes his beer cold, his Bills winning and his mutual funds simple, so you can imagine over the years he’s found himself increasing disappointed, and not just by the Buffalo Bills. The trend among mutual funds has been to develop increasingly opaque strategies as a way to justify high management fees for subpar performance when compared to index funds or ETF’s. From years of researching equity mutual funds I can tell you there are essentially three models; indexed, active managers who are actually indexers, and true active managers; and at the heart of every successful equity mutual fund is a process to find and select individual securities. Some are incredibly complex while others are simply the result of one manager’s particular process. One fund that has eschewed complicated strategies and has still managed to deliver superior returns is the SunAmerica Focused Dividend Strategy (MUTF: FDSAX ), once the darling of Barron’s magazine and that has since fallen on rough times. Now when I say FDSAX has an easy to understand strategy, I mean it’s so easy that even someone relatively new to investing should be able to follow the logic behind its construction. Simply put, it’s something I like to think of as “Dogs of the Dow +” in this case actually the 10 highest yielding stocks in the Dow Jones Industrial Average plus 20 stocks from the Russell 1000 (which may also include the Dogs of the Dows). The stocks chosen from the Russell 1000 are selected based on a screening process that looks at valuation, profitability and earnings growth. The portfolio is put together annually and with the positions more-or-less equally weighted with no concern towards sector weightings and held for an entire year. That’s all there is to it. Now I choose to call it the “Dogs of the Dow +” given that I think it’s fairly reasonable to assume that the 10 highest yielding stocks are likely to be the ten worst performers over the previous year and while the specific metrics used to pick the stocks for the Russell 1000 aren’t publicly disclosed, my assumption is that the system used by SunAmerica would be recognizable to stalwarts of the investment profession like Benjamin Graham. At its core, the investment theory governing the portfolio construction process (as well as any valuation based investment strategy) isn’t quite reversion to the mean but something close; the idea that stocks will gravitate around an intrinsic value, occasionally becoming too expensive or too cheap relative to that value. Over time, investors will become reluctant to pay for already “overpriced” stocks and begin seeking out “cheaper” securities and as the Dow components are some of the largest and most widely followed stocks in the world, they’re a logical place for investors to start their portfolio construction process. As one of the most well-known relative valuation strategies, The Dogs of the Dow Theory has been used for decades, often with mixed results but typically over a long-time period it delivers returns in-line with the broader Dow Jones Industrial Average and often with the benefit of reduced volatility. FDSAX is a good example of relative valuation strategies at work; after underperforming during the latter part of the mid-2000’s bull market, the FDSAX outperformed for 5 of the 7 years between 2007-2013 and in its worst year (2012) only lagged the S&P 500 by 320 basis points but something changed in 2014. Despite the strong outperformance by large-cap value stocks, FDSAX lagged the S&P 500 by 463 basis points and the fund dropped to almost the lowest quartile within the Large Value category. While the trailing three-year annualized return is still 19.84% compared to 20.41% for the S&P 500 and 18.33% for the category as a whole (with less volatility-win/win), it got me thinking…is there a problem with the Dogs of the Dow? The general rule of thumb taught in business schools is that any moderately successful trading strategy that generates excess returns relative to the benchmark is bound to be copied and thus eliminating any further potential for oversized gains. But despite 6 years of college, one more and I could have been a doctor; the Yinzer Analyst has always been something of a heretic. Even after the popularization of the Efficient Market Hypothesis, there’s been ample evidence that shows some individuals can outperform the market both consistently and over sufficiently long periods to prove that there’s more to their outperformance than simple luck. Some degree of skill or investor psychology makes certain trading strategies repeatedly profitable. So lacking anything better to do on a Saturday, I decided to slap together a quick experiment to test the Dogs of the Dow Theory and see if you can reasonable expect that the worst performers from one period (year) will outperform in the next. Now it’s been a long time since I studied statistics, so this is a fairly basic test and just to avoid being called a complete crack-pot, let me outline my process: After pulling the performance data for all Dow Components from 2008-2014, I set up my worksheets to test whether a stock that outperformed (underperformed) the rest of the Dow Jones Industrial Average would outperform (underperform) in the next. So every year is really a two-period test. If you outperformed in 2009 (period 1) did you outperform again in 2010 (period 2.) To be included in the test, the stock had to be present in the Dow for the entire time frame in question. As an example, on 9/24/12, Kraft foods (NASDAQ: KRFT ) was replaced in the Dow Jones by United Healthcare and then on 9/23/13, Alcoa (NYSE: AA ), Bank of America (NYSE: BAC ) and Hewlett Packard (NYSE: HPQ ) were dropped and replaced by Goldman Sachs (NYSE: GS ), Nike (NYSE: NKE ) and Visa (NYSE: V ). So when I was looking at the period of 2012-2013, there were only 26 stocks to test (no United Healthcare, Alcoa, Bank of America or HP) while in 2014, I only had 27 Dow components to test (no GS, Nike or Visa since they weren’t included for all of 2013.) I also only went back to 2009 as I was both pressed for time and not willing to beg someone with access to Direct or Bloomberg to pull additional return data for me. Still, I think the results in the table below are very illuminating: (click to enlarge) As you can see at the bottom of every column, I choose to interpret the results with two basic formulas asking, “If you outperformed in period 1 (example 2009), what were the odds you outperformed in period 2 (2010)?” In the 2009-2010 period, of the 16 stocks that outperformed in 2009, 8 outperformed in 2010. For 2010, the 12 Dow components that underperformed the total index in 2009 (P1) were equally as like to outperform versus underperform the benchmark in 2010 (P2). Although there are too many variables to count as to why one stock outperforms and another doesn’t, and there’s a host of ex-ante versus ex-post issues to consider, if you were simply picking the worst performing Dow stocks for your portfolio, it was a coin toss whether one outperformed the benchmark and another didn’t. While the odds worsened slightly in 2011 and 2012, they were only slightly worse than a coin toss and picking a prior winning stock to keep winning sure didn’t guarantee anything in 2010 or 2012. What’s interesting to me is how the odds have worsened over the last two years to reach the sample extreme in 2014. If at end of 2013 you picked one of the 12 Dow components that underperformed that year, you had a ¼ chance of picking an outperformer in 2014. Only Cisco, Proctor&Gamble and Wal-Mart pulled that off. The other 9 underperformed for a second consecutive year or in the case of Coca-Cola (NYSE: KO ), Chevron (NYSE: CVX ), IBM (NYSE: IBM ), McDonalds (NYSE: MCD ) (all currently held by FDSAX) and Exxon Mobil (NYSE: XOM ) for the third consecutive year in the row. Caterpillar (NYSE: CAT ) (not part of the fund) has now underperformed for four years in a row, some global recovery. Of you could look at it in a different manner; there were 27 stocks in the Dow Jones Industrial Average in 2013 and 2014, if you had picked one at random on 12/31/12, there was a 1/3 chance that you would have underperformed the index over the next two years! No wonder FDSAX underperformed the benchmark in 2014 although it only underperformed the larger category of Large Value funds by 116 basis points. Assuming that most of the outperformers were index funds and that fee’s were a major determinant of outperformance last year, I might have to compare the fund’s performance to other active managers in the space to determine whether FDSAX is a Yinzer Analyst Best Buy, or at the very least how awful active management really was in 2014. If you were part of the management team at FDSAX and if you selected 10 Dow Jones Industrial underperformers on 12/31/13 to include in 2014 and the relationship held, 7.5 (let’s round up to 8) of those stocks would likely underperform in 2014 and with an average weighting of 3.4%, 27.2% of your portfolio was going to underperform in 2014. That’s putting a lot of pressure on the rest of your portfolio to outperform so you can keep yourself around benchmark. If a similar relationship held for stocks within the broader Russell 1000, your chances of performing in-line with the benchmark were slim-to-none while outperforming after fee’s wasn’t even within the realm of possibility. The question is what happens in 2015? Given the extremes between persistence in outperformers and underperformers in 2014; is it reasonable to assume that mean reversion might kick in and see the Dogs of the Dow finally have their day again in 2015? If so, thanks to its formulaic nature; FDSAX could find itself very well-situated to take advantage of that trend. Keep your eyes on those persistent underperformers like Chevron and IBM to see if they can give SunAmerica a happier New Year.