Tag Archives: seeking

Vanguard’s All-World Ex-US Fund Sounds So Good, But Hasn’t Performed
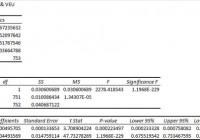
Summary When I’m contemplating funds for my IRA, I like to use Modern Portfolio Theory. The risk level and correlation measured on a daily a basis are unattractive, though the correlation appears much lower in longer scenarios. Despite a great expense ratio and strong dividend yield, I have a hard time getting excited about VEU. It’s a solid ETF, but I’m less excited for it than I usually am for Vanguard funds. Investors should be seeking to improve their risk-adjusted returns. I’m a big fan of using ETFs to achieve the risk-adjusted returns relative to the portfolios that a normal investor can generate for themselves after trading costs. I’m working on building a new portfolio, and I’m going to be analyzing several of the ETFs that I am considering for my personal portfolio. One of the funds that I’m considering is the Vanguard FTSE All-World ex-US Index ETF (NYSEARCA: VEU ). I’ll be performing a substantial portion of my analysis along the lines of Modern Portfolio Theory, so my goal is to find ways to minimize costs, while achieving diversification to reduce my risk level. What does VEU do? VEU uses an indexing approach to track the performance of the FTSE All-World ex-US Index. The first thing I’m looking for is diversification. If the ETF really brings great diversification and can effectively represent all virtually all of the non-US market, then it should be an incredible fit for my portfolio. However, I want to run my own statistics to get a better feel for the performance of the ETF. Does VEU provide diversification benefits to a portfolio? Each investor may hold a different portfolio, but I use the SPDR S&P 500 Trust ETF (NYSEARCA: SPY ) as the basis for my analysis. I believe SPY, or another large cap U.S. fund with similar properties, represents the reasonable first step for many investors designing an ETF portfolio. Therefore, I start my diversification analysis by seeing how it works with SPY. I start with an ANOVA table: (click to enlarge) The correlation measured on a daily basis is higher than I would expect. Given that the ETF is expected to represent all of the non-U.S. market, I was hoping for a correlation closer to 70%. There are plenty of REIT ETFs that have lower levels of correlation. I feel like this ETF may be seeing more of a correlation to the U.S. market than it really should. I want to see low correlations, and this doesn’t seem to offer that. Since it feels wrong for there to be such a strong correlation, I decided to test the statistics against eyeballing the chart. Remember that I’m looking at statistics on a daily basis, so the influences can be money flowing in and out of the market. The image below is a 5-year price chart from Google Finance. (click to enlarge) VEU has performed quite poorly if measured over the entire period. However, it appears clear from the graph that while the correlation of daily returns is high, the overall direction of the lines is not impacted as strongly. Therefore, over a long time period, I would expect the diversification benefits to be better than they are over the short term. In the short term, the ETF moves up and down with SPY, but over the longer term, the performance is dictated by other factors. Standard deviation of daily returns (dividend adjusted, measured since January 2012) The standard deviation is higher than I would expect for an ETF that is expected to be so broad. For VEU, it is .905%. For SPY, it is 0.736% for the same period. The higher volatility, combined with high daily correlation and very unimpressive results over the last 5 years aren’t very attractive to me. I looked back at the numbers since inception, and they aren’t very attractive either. A portfolio split half and half between VEU and SPY, which I’m not recommending, would have scored a .793% for the daily standard deviation. Due to the high correlation and high standard deviation, the daily statistics don’t support the ETF offering much in the way of diversification benefits. Clearly, the long-term price chart shows that there is some substantial diversification. However, I’d be concerned if I allocated a large portion of the portfolio to it. Why I use standard deviation of daily returns I don’t believe historical returns have predictive power for future returns, but I do believe historical values for standard deviations of returns relative to other ETFs have some predictive power on future risks and correlations. Liquidity is great The average trading volume is over 2.4 million shares per day. I have absolutely no liquidity concerns. Yield The distribution yield is 3.52%. That is a fairly attractive yield. This ETF could be worth considering for retiring investors. I like to see strong yields for retiring portfolios, because I don’t want to touch the principal. Higher yields imply lower growth rates (without reinvestment) over the long term, but that is an acceptable trade-off, in my opinion. If the long-term diversification benefits and strong distribution yield encouraged retirees to keep their hands out of the portfolio, that would make the ETF substantially more attractive for investors that needed help in that regard. Expense Ratio The ETF is posting .15% for both gross and net expense ratios. For the expected diversity in the equity securities being held and the risk factors affecting the ETF, that is a very attractive expense ratio. In my opinion, .15% is a fairly attractive expense ratio, regardless of what the ETF is doing. Generally, I think anything less than .20% is doing well for expense ratios. Market-to-NAV The ETF is at a .06% premium to NAV currently. That isn’t large enough to matter for a long-term holder. Check before trading, but I wouldn’t expect to see this ETF deviate from the NAV by a meaningful amount. Largest Holdings The diversification within the holdings looks great. (click to enlarge) Conclusion I’m currently screening a large volume of ETFs for my own portfolio. I have a total of five portfolios that I am personally connected to. My wife and I both have Traditional and Roth IRAs. I also have a solo 401K. The 401K is through Schwab, so I have a preference for ETFs on the OneSource list for that account. The four IRA accounts are with a different brokerage that does offer me any incentives to pick certain ETFs. In those accounts, I will have a preference for using a smaller number of ETFs to achieve my diversification, due to trading costs. Vanguard funds are very attractive, in my opinion, for any accounts that don’t already have commission-free trading. In general, they have low expense ratios and solid diversification. I was given the impression that this ETF would be a strong contender for one or two of the IRA accounts, but so far, I’m not convinced. My current IRA uses some mutual funds that were relatively low-fee, with no trading costs. I want to make some fairly substantial changes. Over the course of a few months, the trading commission on buying into some low-fee ETFs should be covered by the lower expense ratios. The trading costs will encourage me to rebalance less frequently. That makes low volatility even more important to me. I’m stuck in a hard situation with assessing VEU. I love the idea of getting exposure to all the foreign markets with a single ETF, because it reduces trading costs. I don’t like the daily correlation values, but the long-term chart shows that the performance of the VEU isn’t as strongly tied to the S&P 500 as it would appear. For my IRAs (non-Schwab, so no OneSource), the strongest contenders so far for major positions are the Vanguard Total Stock Market ETF (NYSEARCA: VTI ) and Vanguard REIT Index ETF (NYSEARCA: VNQ ). If I can’t find an option that really appeals to me as a single ETF to cover foreign exposure in the IRAs, I may accept going without the foreign exposure. Additional disclosure: Information in this article represents the opinion of the analyst. All statements are represented as opinions, rather than facts, and should not be construed as advice to buy or sell a security. Ratings of “outperform” and “underperform” reflect the analyst’s estimation of a divergence between the market value for a security and the price that would be appropriate given the potential for risks and returns relative to other securities. The analyst does not know your particular objectives for returns or constraints upon investing. All investors are encouraged to do their own research before making any investment decision. Information is regularly obtained from Yahoo Finance, Google Finance, and SEC Database. If Yahoo, Google, or the SEC database contained faulty or old information, it could be incorporated into my analysis. The analyst holds a diversified portfolio, including mutual funds or index funds, which may include a small long exposure to the stock.
Will The Fed Bring Down SLV?

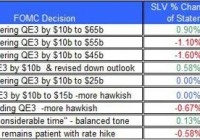
The FOMC’s statement was released on January 28. The price of SLV could come down once the FOMC starts to raise rates. The concerns over the global economy aren’t likely to change the FOMC’s view about raising rates this year. The recent decision of the FOMC didn’t stir up the silver market as shares of iShares Silver Trust ETF (NYSEARCA: SLV ) slightly declined on the day the statement was released. But, the sentiment of the recent statement may suggest the FOMC is still on its road to raise its cash rate in the coming months, which could curb down the recent rally of SLV. Let’s review the latest from the Fed and the potential ramifications of its policy on SLV. The recent FOMC meeting concluded with little changes to the wording of the statement. The FOMC reiterated its stance about being patient over its next rate hike: The Committee judges that it can be patient in beginning to normalize the stance of monetary policy. The FOMC still remains bullish about the U.S. economy mainly when it comes to the labor market – this is partly due to the fall in oil prices. Nonetheless, the FOMC estimates inflation could fall further in the near-term albeit rise back up to its target in the medium-term: Inflation is anticipated to decline further in the near-term, but the Committee expects inflation to rise gradually toward 2 percent over the medium-term as the labor market improves further and the transitory effects of lower energy prices and other factors dissipate. (click to enlarge) Source of data: FOMC’s site and Bloomberg The reaction to the recent decision wasn’t too harsh at first and the price of SLV only slightly declined. The following day, however, SLV tumbled down. In most of the meetings in 2014, the reaction of silver prices to the FOMC statement was mostly negative, because the FOMC’s policy kept turning more hawkish. Lower inflation doesn’t seem to persuade investors that the FOMC is reconsidering not to raise rates later this year. For now, the inflation is likely to keep coming down. Even the 5-year inflation expectations have slowly come down in recent months. (click to enlarge) Chart taken from FRED As you can see, the inflation expectations for the next five years are still not far off the Fed’s 2% target. This figure could decline further in the coming months as low oil prices are likely to pressure it down. But, the Fed still estimates that over the mid-term the inflation will remain around the 2% range – inline with its target. But, the main issue remains whether the drop in U.S. inflation in the near-term and the concerns over the global economy could be enough to persuade FOMC members to push forward the first rate hike and subsequent raises. The progress of the global economy – while it does influence FOMC members’ decisions – isn’t a major factor when it comes to the two mandates the FOMC has – inflation and jobs. When it comes to both cases, the FOMC’s objectives are on the right path. (click to enlarge) Chart taken from FRED This, however, doesn’t include the progress in U.S. wages – they remain relatively low and haven’t picked up in recent months. The little progress in wage could be a factor to tilt the scale towards keeping the Fed’s cash rate low for a longer time than currently estimated. Many still estimate that the FOMC will move forward and raise its cash rate this year. Moreover, most of the FOMC’s voting members also estimate the cash rate will be raised this year – according the December FOMC statement. Finally, it’s worth noticing that unlike the December meeting, in the recent meeting there weren’t any dissenters to the decision. This could be another indication that no major changes were made to rock the boat. If the FOMC remains bullish on the U.S. economy and won’t let the recent drop in U.S. inflation to change its view, then this could mean a rate hike in the coming months. This decision could start to pressure up U.S. treasury yields and thus bring back down the price of SLV. Moreover, the ongoing recovery of the U.S. dollar, which is likely to be boosted by a rate hike, could also adversely impact the price of SLV. In the meantime, even though the price of SLV rose by over 14% during the month, the demand for the silver ETF didn’t rise – the silver holdings of SLV are still around 319 million ounces of silver, which represent a 3.1% drop, year to date. The FOMC’s minutes will be released next month and could provide more insight behind the recent policy meeting. But, until the FOMC starts to raise rates, the concerns over the global economy and the drop in U.S. treasury yields could keep the price of SLV from plummeting again and erasing its gains from earlier this year. For more see: Will Higher Physical Demand for Silver Drive Up SLV?

RevenueShares Ultra Dividend Has Utility

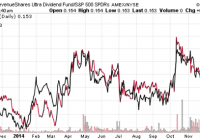
Summary RDIV has a relatively high yield compared to its nearest competitors such as DVY. RDIV takes the S&P 500 Index, pulls out the top 60 highest yielding stocks, and then weights them by revenues. RDIV’s strategy in the current market environment results in a very utilities heavy portfolio. RevenueShares takes a different approach to indexing. Instead of using the market capitalization approach to weighting index constituents, the firm uses a company’s share of revenues. RevenueShares takes an existing S&P index such as the S&P 500 Index and then applies the different weighting methodology. One of the main arguments against market capitalization weighted indexes is the valuation argument. As the price of a stock rises, so does its market cap, and over time a market cap weighted index becomes increasingly weighted towards overvalued shares. By using revenues as a weighting strategy, as a stock price rises faster than its revenue share, it is sold off at rebalancings. If a company’s stock price falls, but its revenues are steady or rise as a share of the index, it is purchased at each rebalancing. In other words, stocks that are overvalued by the price-to-sales metric are sold, and stocks that are undervalued by the price-to-sales ratio are purchased. RevenueShares has a dividend fund that uses this strategy: the RevenueShares Ultra Dividend ETF (NYSEARCA: RDIV ) . Index & Strategy As mentioned, RDIV weights the index by revenues. The index constituent universe is the S&P 500 Index. The field is narrowed to the top 60 stocks, ranked by the average 12-month trailing dividend yield. Holdings are then weighted by revenue. The result is a portfolio heavily overweight the top holdings in the modified index, as well as overweight the “defensive” sectors. The top 10 holdings are book-ended by Duke Energy (NYSE: DUK ) at the top, with a 5.07 percent weight as of January 26, and Kinder Morgan (NYSE: KMI ) at the bottom with 4.20 percent of assets. The top 10 holdings combine for 46.70 percent of assets. Utilities dominate sector exposure, with 39 percent of assets. The telecom sector is also overweight relative to the S&P 500 Index, at 17 percent of assets. Consumer staples and energy make up 16 percent and 13 percent of assets, respectively. Technology is almost non-existent at 0.19 percent of assets. Financials are very underweight relative to the S&P 500 at 4 percent of assets, and there’s no healthcare exposure. This makes for a very “defensive” portfolio whose performance currently lives and dies by the utilities sector. Performance RDIV’s inception date is October 2013. For much of this period, the utilities sector has performed very well and it was the best performing S&P 500 sector in 2014. The first chart here is the price ratio of RDIV versus the SPDR S&P 500 Trust ETF (NYSEARCA: SPY ) in red. In black, for comparison, is the price ratio of the Utilities Select Sector SPDR ETF (NYSEARCA: XLU ) versus SPY. The chart confirms what the sector exposure tells us: RDIV is highly influenced by the utilities sector. (click to enlarge) A dividend ETF with a similarly high concentration in utilities is the iShares Select Dividend ETF (NYSEARCA: DVY ), and the two funds fall into nearly the same section of Morningstar’s Stylebox: Large Cap Value. DVY falls on the line with the mid cap box and gets a Mid-Cap Value classification from Morningstar. The chart below shows the price ratio of RDIV to DVY, plus the price of the Industrial Select Sector SPDR ETF (NYSEARCA: XLI ). Industrials is the second largest sector in DVY. When industrials have rallied, RDIV trailed DVY, and vice versa. (click to enlarge) Finally, here’s a performance chart of RDIV, DVY, SDY and SPY since the inception of RDIV, showing that despite having different sector exposure, they’ve largely traded together. RDIV comes out on top thanks to it large utilities exposure. (click to enlarge) Expenses RDIV charges 0.49 percent. This is higher than DVY’s 0.39 percent and SDY’s 0.35 percent expense ratio. Income RDIV has a trailing 12-month yield of 3.26 percent. With only five quarters of dividend payments, it’s too early to evaluate the fund’s payout growth rate. The yield exceeds DVY’s 12-month trailing yield of 3.03 percent. Conclusion RDIV is a new fund that hasn’t found a large following yet, amassing only $52 million in assets in its first 15 months. The heavy weighting of the utility sector is an issue, but DVY has attracted nearly $16 billion in assets with nearly as much in the sector. Overall, the revenue weighting strategy shows a good track record and the yield on RDIV is competitive with the competition. Sector exposure won’t always lean in favor of utilities this much, but for the foreseeable future that’s likely to still be the case. Investors comfortable with that level of exposure can consider the fund as part of a dividend strategy. The main risk for the fund is the same for the utilities sector and dividend funds more generally. If interest rates stay low, investors will eventually bid up RDIV’s holdings until the yield gap with other dividend ETFs closes. If interest rates increase, the high debt utilities sector will come under pressure and investors will look beyond dividend shares to other income alternatives. Rates have come down substantially over the past couple of months though, so a major rebound will be required to take rates back to a level where they are competitive with stocks. The 30-year treasury yield was 2.40 percent as of January 26, down from 3.1 percent in November.