Tag Archives: seeking

Best And Worst ETFs Of January

The year 2015 began on quite a volatile note and in fact saw the worst start to the New Year since 2008. Standard & Poor’s 500 index fell 3.1% in January while the Dow Jones Industrial Average lost 3.7% – marking its biggest monthly loss in a year. Concerns about the impact of a stronger dollar and lower oil prices on corporate earnings growth continued to bother investors. Moreover, global growth uncertainty also played foul with both the World Bank and International Monetary Fund having slashed their global growth forecasts. The three factors – oil, the strengthening U.S. dollar and lackluster global economic growth – worked in tandem pushing down corporate profitability for Q4 and the estimates for the current and subsequent quarters. Meanwhile, the Swiss National Bank dropped its long-standing exchange rate of the Swiss franc against the euro adding to the current market volatility. At the same time, the political situation in Greece worsened as the Syriza party won the country’s general elections, raising worries about Greece’s exit from the Euro zone. On the other hand, news that the U.S. consumer sentiment rose in January to its highest level in 11 years on better job and wage prospects and consumer spending in the fourth quarter expanded at the fastest pace since 2006 failed to bring in the much need relief to the U.S. markets. Adding to the woes, the U.S. economy expanded at a slower-than-expected pace of 2.6% during the final quarter of 2014. The pace signaled a slowdown in growth after an expansion of 5% in the third quarter and the 4.6% pace in the second. Given the huge market volatility, ultra-safe bond funds emerged as one of the biggest winners in January as investors rushed in for safety. Not surprisingly, some of the commodity and oil & gas ETFs emerged as losers shedding in the double digits. Best ETFs Volatility ETFs Volatility ETFs were the major gainers amid the ongoing turbulence, as these tend to outperform when markets are falling or fear levels are high for the future. The iPath S&P 500 VIX Short-Term Futures ETN (NYSEARCA: VXX ) has been leading the space with a 17% return in January, closely followed by 16.89% for the C-Tracks Citi Volatility Index ETN (NYSEARCA: CVOL ). VXX is the most popular volatility ETN on the market with an asset base of $937.7 million and average trading volume of 43.1 million shares. The fund tracks the S&P 500 VIX Short-Term Futures Index to provide exposure to a daily rolling long position in the first and second months of VIX futures contracts. The expense ratio came in at 0.89%. Bond ETFs Given the uncertainty in the global market, investors are flocking to safe haven long-term government bonds to protect their portfolio from losses. The PIMCO 25+ Year Zero Coupon U.S. Treasury Index ETF (NYSEARCA: ZROZ ), the Vanguard Extended Duration Treasury ETF (NYSEARCA: EDV ) and the iShares 20+ Year Treasury Bond ETF (NYSEARCA: TLT ) emerged as some of the biggest winners in this space gaining in excess of 9%. ZROZ tracks the BofA Merrill Lynch Long US Treasury Principal STRIPS index and holds 21 securities in its basket. The effective maturity and effective duration of the fund stand at 27.38 years. The fund manages an asset base of $164.2 million and charges 15 bps in annual fees. ZROV has a 30-day SEC yield of 2.30% and is up 16% quarter-to-date. iShares Residential Real Estate Capped ETF (NYSEARCA: REZ ) In the current ultra-low environment, investors in search of juicy yields are continuing to pile up real estate funds which offer attractive payouts. The fund follows the FTSE NAREIT All Residential Capped Index and provides exposure to 37 U.S. residential real estate stocks and real estate investment trusts (REITs). REZ manages an asset base of $347.2 million with a 30-day SEC yield of 3.18% and has returned 8% in the past one month. ETF Losers SPDR S&P Metals & Mining ETF (NYSEARCA: XME ) XME was the biggest loser last month dragged down by weakness within the broad commodity space. The fund lost 12.1% in January and is down 31% in the past one year. XME is the largest and most popular fund in the metals and mining space with an asset base of $370.6 million and is highly liquid with an average trading volume of 2 million shares. The fund tracks the S&P Metals & Mining Select Industry Index to provide exposure to a basket of 35 stocks. The ETF charges 35 basis points a year. SPDR S&P Oil & Gas Equip & Service (NYSEARCA: XES ) The persistent decline in oil prices over the past six months has taken a toll on the overall energy sector as well as on the growth prospects of a number of oil producers. XES tracks the S&P Oil & Gas Equipment & Services Select Industry Index providing exposure to a basket of 52 stocks. Sector-wise, Oil & Gas Equipment & Services occupies 72.3% of fund assets followed by 27.7% to Oil & Gas Drilling. The fund manages an asset base of $169.5 million and has lost 11.5% last month. The fund currently has a Zacks ETF Rank #5 or Sell rating. First Trust ISE-Revere Natural Gas Index Fund (NYSEARCA: FCG ) The fund offers exposure to the U.S. stocks that derive a substantial portion of their revenues from the exploration and production of natural gas. It follows the ISE-Revere Natural Gas Index and holds 28 stocks in its basket, which are well spread out across each component with none holding more than 7% of assets. The fund has gathered an AUM of $240 million so far and sees good average daily volume of over 1.3 million shares. The fund has shed 10.5% in January and currently has a Zacks ETF Rank #5 or Sell rating.
What To Do About Poor Future Returns

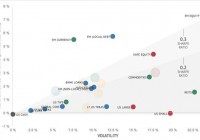
There’s been a lot of chatter recently about asset valuations, in particular U.S. stocks and U.S. bonds, and their impact of future returns. This is nothing new. It just seems to get louder at the start of every new year. I’ve discussed this topic before on the blog. Last time here . Basically, my point was that we may indeed, in fact it’s probable, be facing poor future returns – a least for the next 10 years, but that doesn’t mean that the 4% SWR rule is dead. In fact the 4% SWR implies even worse returns than people are forecasting now. For those building towards retirement it probably means a longer time to hit one’s goals And maybe that’s the worst part of it. In this post I wanted to discuss what the options are for investors if we take the forecasts of poor future returns as a fait accompli. First, some discussion of definitions is in order. Most of the the time when you hear forecasts of poor future returns you hear about the potential for poor U.S. stock returns, and poor U.S. government bonds returns, and the predominant 60% U.S. stock 40% U.S. bond allocation. The 60/40 portfolio is the dominant benchmark used in the U.S. by the finance industry partially due to the fact that they are the asset classes with the best and longest historical data. That is why you hear about it so much. Part of the problem with this of course is that today there are far more assets classes than just these basic two. But for this type of analysis it serves the purpose well enough. Just something to be aware of. Let’s move on. In this post, I’m going to use a recent forecast analysis done by Research Affiliates at the beginning of the year that forecasts future 10yr real asset class returns and the 60/40 portfolio return. You can find that analysis here . They also maintain an updated forecast of 10 yr expected real returns at their asset allocation website . A must visit in my view. Here is a graphical view of their current 10 yr real return forecasts and risk. The classic 60/40 portfolio is way down there. Almost at the bottom left corner with a 10 yr projected real return of 0.4% annualized. Not so great. They forecast U.S. large stocks at 0.4% as well, so that basically leaves 0.4% for bond returns, the benefits of re-balancing, etc. Not exactly outstanding. Just for reference, over the last 10 year period from 2005 to 2014, the 60/40 portfolio has returned 4.8% per year on a real basis, not too far from it’s historical average of 5.2% per year. Let’s take these forecasts as a given and discuss what options an investor has going forward. The most obvious option is to do nothing. If these forecasted returns do come to represent reality then, at least for those withdrawing from their portfolios, the historical 4% SWR will probably be just fine. As the Kitces blog post I linked to in the first paragraph discusses in detail these forecasts of poor future returns would turn out to be an upside surprise to the 4% SWR. In fact, for the worst case retiree in history, starting in 1966, the first 10 year return for a 60/40 portfolio was -1.85% real per year! That’s a lot lower than what is currently being forecasted. In the modern portfolio era, since 1973, there have been four 10 yr periods where the real return was less than 1% per year. Those were the 10 yr periods beginning in 1973, 1999, 2000, and 2001. Sometimes you get the impression that the realization of these poor forecasted returns would be some unprecedented event. Not even close. We’ve been there before and in not the too distant past either. A slight variation to the do nothing option is just to change the allocation between stocks and bonds. If stocks are not offering any higher real returns than bonds then why allocate to them. For example, an investor could go to a 40% stock 60% bond allocation (or 50/50, 30/70, etc…), that has the same forecasted real return but with a lot lower volatility and lower drawdowns. The lower volatility and drawdowns in and of themselves will lead to higher SWRs. The next option is to allocate to assets classes with higher forecasted returns. Obvious, right? The tough part is deciding how to break up that allocation and to into what asset classes. It is much better to simply choose a long standing portfolio allocation that has stood the test of time. I’ll use two examples here that I talk about often on the blog; the Permanent Portfolio, and the IVY 5 asset class buy and hold portfolio. Taking the asset allocations for the portfolios and plugging in the forecasted returns from the Research Affiliates forecast you get the forecasted 10yr returns for the strategies shown below. The Permanent Portfolio’s forecasted 10 yr real return is 0.9%. That’s much better than 60/40 but still a lot less than it’s average 10yr real return since 1973 of 5%. However the Permanent Portfolio comes with a lot less volatility (30% less) than 60/40 and a lot lower drawdowns which leads to a higher SWR than implied just by the return alone. The IVY5 Portfolio’s forecasted 10 yr real return is 2.2%, compared with it’s 7% average since 1973. I didn’t forecast the IVY13 portfolio because there were no forecasts for certain key factors, like value and momentum, but assuming historical relationships, lets say the IVY13 forecasted 10yr real returns are in the 2.5% to 3% per year. As you can see, going global and diversifying more enhances the projected returns. Now, lets see how some of the tactical asset allocation models may perform in the future under these poor future return forecasts. For this part of the discussion, I’ll be comparing the GTAA5, GTAA13, GTAA AGG3, and GTAA AGG6 portfolios to the buy and hold portfolios discussed above. The first thing I’ll do is compare the performance of the tactical asset allocation portfolios over all 10 yr periods to the buy and hold portfolios; 60/40, IVY5, and Permanent. Then we’ll compare the performance over only the worst 10 yr periods. That will give us a gauge of their relative performance during these bad return periods we are interested in. Below is the key table. The first line in the table shows the average real 10 yr period performance for each of the portfolios for all 10 yr periods since 1973 (1973 to 1982, 1974 to 1983…through 2005 to 2014). The 60/40 portfolio returned on average 5.82% real per year, the IVY5 7.06%, the AGG6 portfolio 14.15%, etc… The next row shows the spread between the particular portfolio and the 60/40 classic buy and hold portfolio. For example, GTAA5 outperforms 60/40 on average about 1.82% per year. Now it gets interesting. The next row shows the average 10 yr period performance only for those 10 yr periods where the 60/40 return was less than 1% per year real. The performance for all the portfolios is lower as one would expect but look at the next row, the spreads to the 60/40 portfolio during these poor return periods. The outperformance of all the portfolios is better during bad periods. For example, GTAA5 only outperforms 60/40 by 1.82% per year during all periods but during bad periods it outperforms by 6.8% per year! That is pretty astonishing. The TAA portfolios have risk reduction built in automatically and keep the investor out of long down markets, exactly what is being forecasted for the buy and hold portfolios. Sounds like a pretty good portfolio approach to me especially if the forecast of poor returns comes to be. If similar spreads hold true in the future the TAA portfolios would be looking at 10 yr real performance ranges of 6-8% per year for the GTAA5 and GTAA13 portfolios and 13-15% per year for the GTAA AGG3 and AGG6 portfolios. Sounds to good to be true but even if the performance ranges are half of what they’ve been an investor will be a lot better off than in a traditional 60/40 portfolio. The structure of the portfolios stacks the odds in the investor’s favor during bad markets. In summary, I’ve shown that if forecasts of poor returns come true the portfolio outcomes for investors are no worse than the past. An investor doesn’t need to do anything different. But there are better options that stack the odds in the investor’s favor in poor return environments. The most basic option is better diversification as exhibited in the IVY5 and the Permanent Portfolio as examples. And then there are even better options by using tactical allocation models that protect to the downside and in aggressive versions tilt the portfolio toward the best performing asset classes. While all returns for all portfolios will be lower in a low return environment the outperformance of better constructed portfolios will still allow investors and especially retirees to outperform and meet their long term goals.

Volatility Is Whipsawing Investors, Which Side Are You On?

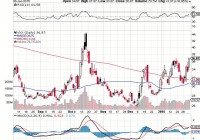
Volatility has been swinging wildly in recent weeks. This provides investors with trading opportunities but the risks are large. I’ll outline my forecast for volatility and what side of the trade I’m on right now. A couple of weeks ago I wrote about how I was taking the plunge and shorting volatility by proxy using the iPath S&P 500 VIX Short-Term Futures ETN (NYSEARCA: VXX ) and its inverse ETP, the VelocityShares Daily Inverse VIX Short-Term ETN (NASDAQ: XIV ). I’ve been trading in and out of volatility since the flash crash of last October and while I’ve had pretty good fortune, trading volatility is not for the faint of heart. The moves are swift and brutal and if you’re wrong, you’ve got to be willing to move quickly. Sometimes that means taking a beating in the process but living to fight another day because the profits can be huge if you’re on the right side of the trade. Last time I visited volatility I was, as I said, shorting it. Another VIX spike had just occurred and I took the plunge and shorted the VXX via XIV, the inverse ETP to VXX. I shorted the VXX by selling my long VXX position at $36 and buying XIV at $26 on the same day. It turns out that was a decent move because, as you can see below, the spike end that day. (click to enlarge) I rode the plunge in the VXX to a price of $29+ on the XIV before taking profits and as we can see, the VXX bottomed a short time after. If we fast forward to last week, I actually took a long position in VXX at $31.60 and put on the same covered call trade I outlined for you in early January . This is my preferred method for getting long volatility for two reasons. First, in case you’re wrong, you have some cushion to the downside. And while a full-blown meltdown cannot be fully abated with call premiums, it helps. Secondly, when volatility is high like it is now, premiums on the VXX are downright enormous. You can collect a 3%+ premium for a weekly call that expires in five days when implied volatility is high. That’s how you put the odds in your favor and that’s how I like to play VXX. On Friday, as volatility spiked once more, I sold out of my profitable VXX long position and subsequently went long the XIV, thereby shorting the VXX, on Friday morning at a price of $27.25. As it turns out, I was way early on that move, as the VXX finished the day roughly 8% higher than where I began shorting it and that’s why it’s important to understand the risks when trading volatility; the moves can be swift and huge and cause eye-popping gains and losses in the process. However, I’m undeterred by a few hours of action and as long time readers will note, the first time I shorted volatility in October started out much the same way with large losses that eventually turned around. Of course, I don’t have a crystal ball but I feel that traders are getting tired of the negativity at that while I obviously missed the top, I think I was somewhat close. As for this week and the coming weeks, I don’t see a lot of real negative catalysts. The oil crash story is getting old and the worries about deflation, while well-grounded, can only dominate headlines for so long. The ECB and the Fed continue to bazooka money into the markets whenever somebody sneezes and that means volatility spikes should be met with some buying interest and buying interest means lower volatility. Of course, some unexpected event could arise but that is true 100% of the time and not exclusive to current circumstances. My outlook for volatility is that we’ll see it die down in the first week of February and depending on when the cool down period happens, I’ll look to make my move out of XIV. But for now, I’m short volatility because the VXX at $37 is not a sustainable condition. Granted, VXX may go much higher than it is now and if it does, I’ll add to my short position but at $37, I’m willing to take a bet that the top is near. If we take a look at the chart above we can see a very well defined channel that the VXX has been trading in since December and with shares nearing the top of that channel, that’s why I’ve gotten short. I wish, of course, I’d gotten short $2 later than I did, but those are the breaks sometimes. So while I’m currently sitting on a very fresh, very painful loss on my short position, the chart gives me lots of hope that the losses will be short-lived. I like a short VXX position down to $32 or so and maybe lower depending on how long the selloff takes when it happens, because it will; it always does. I think investors are facing fatigue from the negativity and that fatigue will lead to an exhaustive blow out of volatility, which, just maybe, is what we saw on Friday. Either way, I think lower volatility is headed our way. Disclosure: The author is long XIV. (More…) The author wrote this article themselves, and it expresses their own opinions. The author is not receiving compensation for it (other than from Seeking Alpha). The author has no business relationship with any company whose stock is mentioned in this article.