Gold-Stock Trading Volume Really Growing
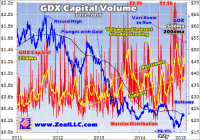
Gold-stock trading volume is high and growing, revealing much trader conviction behind the strong early-year rallies in gold and silver stocks. The higher the volume underlying any particular move, the greater its strength and staying power. And the volume in the gold juniors, which are slaved to sentiment, is incredible. Since trading volume generally grows as uplegs mature, seeing such high volume already in such a young gold-stock upleg is a very bullish omen. There’s no doubt the gold-mining stocks remain deeply out of favor, collateral damage from the Fed’s gross financial-market distortions of recent years. But sentiment is shifting, with stock traders starting to regain interest in this left-for-dead sector. Gold-stock trading volume is really growing as capital returns. And since higher volume is an essential precursor to major new uplegs, its growth is a very bullish portent. The leading gold-stock sector benchmark these days is the Market Vectors Gold Miners ETF (NYSEARCA: GDX ). Its excellent basket of the world’s elite gold and silver miners, which are effectively market-capitalization weighted within this ETF, deftly mirrors the stock-market fortunes of this entire industry. And they’ve certainly been ugly thanks to the Fed’s artificial stock-market levitation. As the US stock markets soared in 2013 on the Fed’s wildly unprecedented QE3 debt monetizations , all demand for alternative investments including gold withered. Gold’s resulting epic plunge on extreme selling of SPDR Gold Trust ETF ( GLD) shares obliterated the gold stocks. GDX plummeted 54.5% in 2013, and then drifted another 13.0% lower last year. It’s no wonder stock traders utterly despise gold stocks today. But they sure shouldn’t, as the most out-of-favor battered-down sectors always have the greatest upside potential. And stock investors and speculators are starting to understand this. In January 2015, heavy gold-stock buying catapulted GDX 21.3% higher! Gold stocks were almost certainly the best-performing sector in the entire stock markets. And that buying was even more impressive coming on heavy volume . Naturally price action itself is the most-important technical indicator, since it exposes underlying supply-and-demand trends. Ultimately all stock prices are determined by the balance between shares offered and bid for. But trading volume, how many shares change hands daily, is a critical secondary indicator. It reveals traders’ overall conviction for any particular move, and thus its strength and potential staying power. While low-volume moves are likely to soon fizzle out as they quickly exhaust themselves, high-volume moves often signal major trends . And this young new year’s gold-stock buying has happened on big volume. This greatly increases the odds that a major reversal happened in gold stocks late last year as they hit apocalyptic fundamentally-absurd lows, and that a major new upleg is just getting underway. This bullish revelation is readily apparent in a long-term gold-stock volume chart. Since GDX is easily the most-popular destination for stock-market capital seeking gold-mining exposure, its trading volume is an excellent proxy for this sector’s as a whole. But since gold stocks are usually excessively volatile, raw GDX volume isn’t a great measure over a long span of time. Share-price fluctuations mask the real trend. At GDX’s unadjusted record high approaching $67 in September 2011, 100 shares were worth $6700. But after subsequently collapsing 75% to its recent nearly-all-time-record low under $17 in November 2014, those same shares were only worth $1700. Obviously shares traded at high GDX prices were a lot more significant than shares traded at low prices. So it’s important to adjust for such divergent prices. This is easily accomplished through a simple construct called capital volume . Each day’s actual share trading volume is multiplied by that day’s adjusted (for stock dividends and splits) closing share price. That shows the amount of capital actually changing hands in GDX shares in perfectly-comparable terms across long periods of time. And even from this perspective, the growth in GDX trading has been massive. This chart shows GDX capital volume over the past 4 years or so, rendered in red. Since trading volume is such a hyper-volatile dataset, a 21-day moving average (one month) is included in yellow to distill out the underlying volume trend. Finally GDX itself is superimposed over the top in blue for reference. The trading-volume growth in GDX shares recently has been very impressive, even in capital-volume terms. The recent extremely-low gold-stock price levels reflect the universal antipathy for this sector. In early November, GDX was trading at the same levels only seen for a single trading day in the dark heart of late 2008’s once-in-a-century stock panic! Gold stocks had almost never been so deeply out of favor as they were late last year. The great majority of stock traders had forgotten about this sector or left it for dead. In such an exceedingly-bearish environment, gold-stock trading volume should’ve shriveled away to nothing. With stock investors and speculators presumably having virtually zero interest in owning gold stocks, GDX’s capital volume ought to have totally collapsed. But incredibly just the opposite happened! The total value of this benchmark gold-stock ETF’s shares changing hands continued to steadily grow. This trend actually began way back in mid-2012, thanks to the underlying gold-price action which is the ultimate driver of gold-mining profits and hence gold-stock price levels. After gold soared to extremely-overbought levels in August 2011, it needed to correct. And this happened naturally over the next 9 months or so, where gold retreated about 19%. This fueled a 41% GDX correction over a similar span. The gold stocks were bottoming in mid-2012, and soon started surging again as gold recovered. But that nascent gold rebound was short-circuited by the Fed’s radically-unprecedented third quantitative-easing campaign launched just before the critical presidential elections. The stock markets started to soar on the Fed’s massive inflationary money printing and endless promises of a lot more if necessary. So gold started to collapse, crushed by the deluge of new supply unleashed by stock traders dumping GLD gold-ETF shares far faster than gold itself was being sold. Gold stocks immediately followed gold lower, and leveraged its downside like usual. So GDX’s capital volume grew despite lower share prices throughout 2013 on heavy selling. That kicked off the longstanding volume uptrend shown in this chart. There were certainly episodes in GDX’s anomalous Fed-sparked collapse that reflected selling surging to capitulation levels. Inevitably in any long downtrend, the great majority of investors and speculators give up and throw in the towel. The numbers of capitulating traders swell during particularly sharp plunges to major new lows. Such periodic flushing events of traders fleeing GDX helped ramp its volume. Since stock traders are typically-emotional human beings, their collective decisions on when to buy and sell as a herd are fueled by popular greed and fear. And these dangerously-misleading emotions for traders grow very asymmetrically . While greed mounts gradually as uplegs power higher, fear flares up quickly in major selloffs. So high-volume selling episodes marking widespread capitulation are normal. But provocatively, recent years’ biggest gold-stock volume spikes didn’t merely come in capitulations. Instead they also arrived in this sector’s periodic sharp rallies. Note that GDX capital volume soared in the summer-2013 rally, spring-2014 rally, and summer-2014 rally. That is very contrary to normal market behavior, defying expectations. It likely reflects sizable latent investor interest in gold stocks despite their struggles. This surprising buy-like-crazy-on-gold-stock-rallies trend continued since GDX plumbed its latest major low in mid-December. As gold stocks recovered in the 7 weeks since, GDX capital volume just soared. And it’s really at incredible levels these days. In January 2015, GDX capital volume averaged $1.2b per day. That’s considerably higher than August 2011’s $0.9b, which was heading into GDX’s record high! This is extraordinary and exceedingly bullish for the beaten-down gold stocks. In major uplegs, trading volume grows gradually . It tends to start out small as the early contrarians buy in, and then slowly ramps up. As prices rise, they capture the attention of more traders who decide to buy in later and ride the upleg. So if gold-stock trading volume is already this high now, imagine how high it will balloon later. Volume and interest are steadily growing in gold stocks, despite epically-bearish sentiment still plaguing this sector. The early contrarian investors buying in now ahead of the thundering herd are likely to earn fortunes as gold stocks mean revert higher. This sector is tiny relative to general stocks, and still has vast room to rally yet coming off such extreme lows. It won’t take much capital to catapult it far higher. After the last time GDX’s price briefly fell to such extreme lows in late 2008’s crazy stock panic, this gold-stock ETF would more than quadruple over the next several years. And the late-2014 lows were even more extreme than the stock panic’s in valuation terms. In late October 2008, gold had plunged near $732. Yet in early November 2014 when GDX hit those same lows, gold was fully 56% higher near $1144! As I’ve been pounding the table about in recent months, it is fundamentally absurd for gold stocks to be trading as if gold was far lower than it really is since the yellow metal drives their profits and hence ultimately stock prices. In terms of the venerable HUI/Gold Ratio , gold stocks were trading at levels last seen over 11 years earlier when gold was near $350. Seeing the same levels at $1150 was ludicrous . And that’s probably the primary motivation behind the early contrarian stock investors and speculators already flooding back into this deeply-out-of-favor sector. They understand stock prices are forever cyclical , that huge mean reversions higher always follow extreme lows. Their buying is the vanguard of a major sentiment shift getting underway in gold stocks, which will eventually eradicate the excessive fear dogging them. Nowhere is this more apparent than in the junior gold stocks . Unlike the elite gold and silver majors that comprise GDX, the juniors generally don’t have operating mines. And without cashflows, there’s no fundamental case to be made for them needing to mean revert far higher merely at current prevailing gold prices. With no operations, junior-gold stock levels are far more based on sentiment than fundamentals. GDX conveniently has a sister ETF that tracks junior explorers and smaller miners, the Market Vectors Junior Gold Miners ETF (NYSEARCA: GDXJ ). While GDX’s capital-volume chart is very encouraging, GDXJ’s is just shocking . It offers the most conclusive evidence I’ve yet seen that gold stocks as a sector have decisively bottomed, with a major new upleg underway as sentiment starts to shift. While major gold and silver miners have suffered an exceedingly-rough couple of years thanks to the Fed’s gross financial-market distortions, the juniors have been destroyed. No one has ever seen such carnage in these explorers and small miners, it’s radically unprecedented. GDXJ certainly reflects this, even though it contains the biggest and best of the juniors. It plummeted a staggering 60.8% in 2013 alone! Things got so bad in the middle of that year that GDXJ’s custodians felt compelled to execute a risky 1-for-4 reverse stock split . Investors generally hate reverse splits, because the lower share numbers in their accounts leave them feeling cheated. And it certainly didn’t help GDXJ, which continued to sell off into the end of 2013. Volume and interest continued steadily shrinking, as they had been doing for years. And it’s not hard to understand why. Without operations, junior gold companies have to rely on share offerings to finance their efforts to find deposits and bring them to production. With share prices falling seemingly forever with no bottom in sight, investors overwhelmingly fled this risky sector. Countless juniors were forced to shut their doors, unable to obtain financing in the most-hostile environment ever witnessed. So even hardcore contrarians largely abandoned the juniors, they were just too risky. But when gold started to show some signs of life early last year, capital flooded back into this tiny subsector. As GDXJ shot higher, capital volume exploded to record average levels. It faded again as gold retreated in the spring of 2014, but then skyrocketed as gold surged mid-year on Janet Yellen claiming there was no inflation. After averaging a trivial $52m per day of GDXJ shares changing hands in 2013, capital volume in this leading junior-gold-stock benchmark had multiplied dramatically to $393m on average in July 2014. After a drought of investor interest lasting years, they were finally starting to return. Then unfortunately extreme gold-futures shorting crushed gold late last year, pulling the rug out from under the juniors. The resulting capitulation selling was staggering beyond belief, just gargantuan. In November 2014 as gold-stock prices collapsed to brutal new lows, stock traders fled GDXJ so aggressively that average daily capital volume hit an astounding $639m! If that isn’t the king of all capitulations, I don’t know what is. Just look at the recent capital-volume spike in GDXJ’s chart compared to everything that came before it. Once again junior gold stocks are a pure sentiment play , they are difficult if not impossible to value on a fundamental basis with no operations. And seeing such an epic capitulation late last year just has to mark peak fear in this subsector, and therefore gold stocks as a whole. Once every trader susceptible to being spooked into selling low is scared out, that signals maximum fear and therefore the ultimate bottom . Such a crazy capitulation extreme in a gold-stock subsector wholly hostage to sentiment is the best bottoming indicator I’ve ever seen. It vastly increases the odds that gold stocks are not going any lower and a new upleg is getting underway as sentiment starts shifting away from extreme fear. And GDXJ itself actually supports this thesis. Though it lagged GDX in January 2015, it still climbed 15.9% higher. But much more important than juniors’ still-anemic gains was GDXJ’s huge capital volume last month. It averaged $488m per day in January, which is absolutely enormous compared to this ETF’s entire history outside of late 2014’s extreme capitulation! When GDXJ approached its all-time record high near $152 split-adjusted in April 2011, capital volume averaged just $88m per day in March 2011. Remember that upleg life cycles see rising trends in volume. Initially as new uplegs are born, they are driven by a relatively small fraction of contrarian investors. Then as prices gradually rise, they attract in more and more capital so volume grows on balance. And if the junior-gold trading volume is already this high, just imagine how much investor interest is coming as GDXJ continues to march higher. Gold and silver stocks have vast room to keep running. Not only were they just trading at fundamentally-absurd price levels, but investors are radically underinvested in this sector after abandoning it over the past couple years. The market capitalization of the gold and silver stocks remains so small that this sector could easily quadruple and still account for well under 2% of stock investors’ overall portfolios. And with stock traders now flocking back to gold via GLD shares in a big way, gold itself is starting to mean revert dramatically higher. That will drive great investor interest in the precious-metals miners’ stocks. The growing capital inflows will ultimately power this tiny sector far higher. And stock investors and speculators can definitely ride these great coming gains in GDX and GDXJ, which are fine ETFs. The bottom line is gold-stock trading volume is high and growing. This reveals much trader conviction behind the strong early-year rallies in gold and silver stocks. The higher the volume underlying any particular move, the greater its strength and staying power. And the volume in the gold juniors, which are slaved to sentiment, is incredible. Their extreme capitulation just witnessed likely marks the final bottom. And volume grows as uplegs mature, so seeing such high volume already in such a young gold-stock upleg is a very bullish omen. As gold stocks continue powering higher on balance, more and more traders will jump in for the ride accelerating their climb. And there is vast room for buying after a couple years of investors totally abandoning this sector. Gold stocks will have to soar far higher to normalize. Adam Hamilton, CPA February 6, 2015 Copyright 2000 – 2015 Zeal LLC (ZealLLC.com) Disclosure: The author has no positions in any stocks mentioned, and no plans to initiate any positions within the next 72 hours. (More…) The author wrote this article themselves, and it expresses their own opinions. The author is not receiving compensation for it. The author has no business relationship with any company whose stock is mentioned in this article. Additional disclosure: I own GDXJ call options, as well as extensive positions in gold and silver stocks which have been recommended to our newsletter subscribers.