Tag Archives: seeking

Is FirstEnergy’s Rally Driven By Low U.S. Treasury Yields?
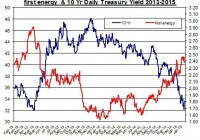
Summary FirstEnergy’s stock added nearly 30% in the past six months. Have low U.S. treasury yields increased the demand for FirstEnergy? What are the other factors that could also drive up shares of FirstEnergy? Shares of FirstEnergy (NYSE: FE ) have added nearly 30% to their value in the past six months. The common notion is that falling U.S. treasury yields tend to increase the demand for utility companies such as FirstEnergy. But is this the case? Also, what are some of the other factors that could drive up the price of FirstEnergy? Do U.S. treasury yields matter? To answer this question, let’s examine the relation of the 10 year treasury yield and the movement in FirstEnergy’s stock over the last couple of years. Source of data taken from Google Finance and U.S. Treasury At first glance we can see in times when treasury yields have gone down, as was the case in recent months, the stock of FirstEnergy rallied and vice versa. But after reviewing the linear correlation between the two sets of data – the correlation for the period was only -0.05 – it’s harder to make the case for a strong relation between U.S. treasury yields and FirstEnergy. But still the relation could be more a matter of people slowly moving their funds to utility companies such as FirstEnergy rather than having a direct clear cut reaction to these changes in the market. In other words, the relation could be more in the trend line than in the day to day shifts. This could all change if the FOMC were to start to raise its cash rate in the second half of the year, which should increase treasury yields. One of the main reasons people like to invest in utility companies such as FirstEnergy is for its stability and relatively high yields. The current annual dividend yield is 3.6%. In comparison, Exelon (NYSE: EXC ) and Duke Energy (NYSE: DUK ) also offer similar dividend yields of 3.4% and 3.7%, respectively. But these factors aren’t the only reasons for the higher demand for FirstEnergy. Here are a few of more reasons to consider: The company is also aiming to expand its operations: FirstEnergy is in the midst of a potential of $7 billion investment in transmission across 24,000 mile transmission system in its Regulated Transmission segment – which transmits electricity through transmission facilities. Back in 2014 the company allocated $4.2 billion for this investment, which is expected to conclude in 2017 and result in the upgrade and expansion of the transmission system. For 2014, the company estimated capex for this project to reach $1.35 billion. These investments will be funded via debt, issuing stocks, employment benefits and cash. Electricity generation is expected to rise in 2015 Based on the latest report by the Energy Information Administration , consumption of electricity in the residential sector is expected to slightly decline by 0.3% in 2015, year over year. This is mainly due to 12% drop in heating degree days this year compared to 2014. Despite the lower demand for electricity in the residential sector, electricity generation is still projected to rise by 1.1% in 2015. Moreover, the EIA also estimates retail residential prices to rise by 1.1% in 2015. This could suggest higher revenue for utility companies such as FirstEnergy. The company will release its fourth quarter report at the end of February, in which the company may provide an update on its guidance for 2015. Lower coal and natural gas prices Another thing that plays in favor for FirstEnergy is the currently low coal and natural gas prices. The company’s fuel mix includes 57% coal and 8% natural gas. The current price of coal (Central Appalachian) is around $46 per short ton – back in early 2014 the price was close to $60 per short ton. Moreover, natural gas is roughly $2.6. In comparison, back in February 2014 the price of natural gas was over $5. The low energy prices are likely to improve FirstEnergy’s profit margin in the first quarter of 2015 and subsequent quarters, assuming coal and natural gas prices remain at their current low levels. Takeaway FirstEnergy is benefiting from low energy prices, falling U.S. treasury yields and potential rise in retail prices in the coming months. These factors are likely to keep the company an interesting investment opportunity. Disclosure: The author has no positions in any stocks mentioned, and no plans to initiate any positions within the next 72 hours. (More…) The author wrote this article themselves, and it expresses their own opinions. The author is not receiving compensation for it (other than from Seeking Alpha). The author has no business relationship with any company whose stock is mentioned in this article.
SPY And U.S. Economic Index Move In Sync For Third Straight Month

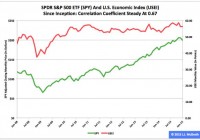
Summary The SPDR S&P 500 ETF and my U.S. Economic Index in January reversed their roles of a month earlier, as the former dropped and the latter dipped. The exchange-traded fund and my economic indicator moved in the same direction in each of the past three months. The correlation coefficient between them over the lifetime of their relationship held steady at 0.67. The SPDR S&P 500 Trust ETF (NYSEARCA: SPY ) and my U.S. Economic Index both headed south in January for the second straight month, but, as was the case in December, the magnitudes of their moves were quite different. SPY’s (quarterly) adjusted closing monthly share price slid to $199.45 from $205.54, a decline of -$6.09, or -2.96 percent, while the USEI’s (annually) adjusted level slipped to 56.31 from 56.33, a decline of -0.02 points, or -0.03 percent. Combining Institute for Supply Management manufacturing and nonmanufacturing figures with a special sauce, I assembled the USEI in an effort to capture all American economic activity in a single monthly number I can employ in guiding my investing and trading, as I mentioned when introducing the metric at J.J.’s Risky Business . Readers with an interest in my articles about the SPY-USEI relationship published during the past year are probably aware the SPY data series I employ historically has been adjusted quarterly. However, they are possibly unaware the three underlying USEI data series I use to calculate the index reading historically have been adjusted annually. Thanks to our ISM droogies bringing up-to-date their manufacturing and nonmanufacturing statistics this week, I was able to slather them with my special sauce, so the USEI’s annual adjustment in 2015 is complete. The most noticeable effect of this adjustment centers on the index’s value at its all-time high. Before the adjustment, the USEI peak was the 59.53 calculated for August 2014, followed by the 59.23 calculated for November 2014. After the adjustment, the index peak is the 58.65 calculated for last November, followed by the 58.54 calculated for last August. All the below data reflect the annual adjustment. Figure 1: SPY, USEI Monthly Values, January 2008-January 2015 (click to enlarge) Note: The SPY adjusted closing monthly share-price scale is on the left, and the USEI monthly value scale is on the right. Source: This J.J.’s Risky Business chart is based on proprietary analyses of ISM data and Yahoo Finance adjusted closing monthly share prices. ISM published its latest manufacturing data Monday and its latest nonmanufacturing data Wednesday. It has reported the relevant figures in the former series since January 1948, but the relevant numbers in the latter series since just January 2008. Thus, the complete data set for the USEI covers only 85 months (Figure 1). I calculate the SPY-USEI correlation coefficient as 0.67 during this period, the same as in each of previous two months. The comparable statistics were 0.66 for October, 0.65 for September, 0.64 for August, 0.63 for July and 0.61 for each of the four months between March and June. Therefore, the coefficient rose five months in a row until December. Figure 2: SPY-USEI Correlations, January 2009-January 2015 (click to enlarge) Note: My baseline conceptually consists of the first 12 SPY-USEI correlation coefficients, which are excluded here. Source: This J.J.’s Risky Business chart is based on proprietary analyses of ISM data and Yahoo Finance adjusted closing monthly share prices. For the USEI’s first 57 months (i.e., before the dawn of the U.S. Federal Reserve’s most recent quantitative-easing program, aka the Age of QE3+ ), I calculate the SPY-USEI correlation coefficient as 0.75. I interpret this number as evidence of a positive correlation between the equity market and the economy that was both stable and strong. For the index’s last 28 months (i.e., after the dawn of the Fed’s Age of QE3+), I calculate the SPY-USEI correlation coefficient as 0.57. I interpret this number as evidence of a breakdown in their relationship, indicating a disruption in the continuous feedback loop between the stock market and the economy. However, this disruption’s effects have been fading since the Fed began to significantly taper QE3+, as documented by the SPY-USEI correlation coefficient’s movement during the past seven months (Figure 2). This lengthy trend suggests substantial progress in the normalization of the relationship between the market and the economy. Figure 3: USEI Monthly Mean And Median Values, 2010-2014 (click to enlarge) Note: The current expansion began in June 2009, according to the Business Cycle Dating Committee of the National Bureau of Economic Research . Source: This J.J.’s Risky Business chart is based on proprietary analyses of ISM data. Neither the first quarter in general nor February in particular historically has been a great time for SPY, as documented elsewhere . Consistent with the ETF’s behavior and the interlocking nature of the SPY-USEI relationship, analysis of the seasonality of the USEI likewise indicates the same two periods have been among the weakest time frames of the annual cycles during the initial five full years of the current economic expansion from 2010 to 2014 (Figure 3). Figure 4: USEI Monthly Values, 2015 Versus 2010-2014 Mean (click to enlarge) Source: This J.J.’s Risky Business chart is based on proprietary analyses of ISM data. The USEI was an overachiever to a significant degree in January when compared with the relevant mean value compiled for the same month during the initial five full years of the current expansion (Figure 4). From January to February in this period, the index fell thrice and rose twice, once by a little (0.02 percent) and once by a lot (1.75 percent). Figure 5: USEI Monthly Values, 2015 Versus 2010-2014 Median (click to enlarge) Source: This J.J.’s Risky Business chart is based on proprietary analyses of ISM data. The USEI also was an overachiever to a significant degree in January when compared with the relevant median value compiled for the same month during the initial five full years of the current expansion (Figure 5). Statistically, the preponderance of the evidence suggests it is probable the index will be lower in February than it was in January. Figure 6: USEI Monthly Values With 3-Month And 12-Month SMAs (click to enlarge) Source: This J.J.’s Risky Business chart is based on proprietary analyses of ISM data. The conditions underlying the USEI’s current status should do nothing to create a roadblock for a Federal Open Market Committee on its way to announce its first interest-rate increase in eight-plus years as soon as April 29, six months after the Federal Reserve concluded asset purchases under QE3+ (Figure 6). And I suspect such an event would be a big deal, not only for the economy, as represented by the USEI, but also for the large-capitalization segment of the market, as represented by SPY. Disclaimer: The opinions expressed herein by the author do not constitute an investment recommendation, and they are unsuitable for employment in the making of investment decisions. The opinions expressed herein address only certain aspects of potential investment in any securities and cannot substitute for comprehensive investment analysis. The opinions expressed herein are based on an incomplete set of information, illustrative in nature, and limited in scope. In addition, the opinions expressed herein reflect the author’s best judgment as of the date of publication, and they are subject to change without notice. Disclosure: The author has no positions in any stocks mentioned, and no plans to initiate any positions within the next 72 hours. (More…) The author wrote this article themselves, and it expresses their own opinions. The author is not receiving compensation for it (other than from Seeking Alpha). The author has no business relationship with any company whose stock is mentioned in this article.

How To Hunt For Deep Value Stocks With Bravery Over Patience

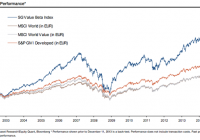
Everyone loves a bargain but choosing a strategy for finding mispriced shares isn’t as simple as it seems. Eighty years after Ben Graham and David Dodd laid the groundwork for what’s known as value investing , some of the brightest minds in finance are still working on the best ways of capturing deep value. Given that research has long shown that cheap beats expensive over the long run, honing a value strategy is clearly worth exploring. So where do you start? When Graham and Dodd wrote Security Analysis in 1934, they changed the rules on how investors should think about stocks. Chastened by catastrophic stock market losses a few years earlier, they urged investors to stop chasing expensive “glamor” and obsessing about earnings growth. Instead, they showed that it was mispriced and undervalued stocks that offered the best chance of outperformance. Ever since, investors have deployed an armory of metrics to help them find shares that don’t reflect the expected value of the companies behind them. Usually, they compare a company’s share price against what it earns — such as the price to earnings ratio — or against what it owns — such as the price to book ratio . One value ratio is never enough When it comes to these value ratios, investors often stick to their favourites. Just take a look at the the guru strategies we track at Stockopedia — many of them use just one valuation metric. But others think it’s too simplistic to use a single ratio to find and compare value stocks. In 2014 the equity research team at investment bank Societe Generale tackled this head on. Led by quant strategist Andrew Lapthorne, they’d already been tracking one value strategy called Quality Income . As the name suggests, it looks for good quality, dividend paying companies. But the focus on relatively high dividend yield is also a signpost to shares that might be cheaply priced. Quality Income was devised for what SocGen call “patient” value investors. These are the ones who are happy to let dividends compound over time in return for less volatility than you see in other types of value strategies. But Quality Income doesn’t get its hands dirty with another major source of value in the market. This is the one that most of us think of when it comes to deep value — buying beaten up, distressed, unloved and ignored stocks. Some of these laggards will never recover but others will bounce back and then some. So SocGen created an alternative strategy for the “brave” investor. Rather than rely on one single ratio, it combines five well known value factors to find stocks that are cheap relative to their sectors. Bravery is needed because these could well be companies with problems. And that means there can be sharp initial losses before the value in them eventually “outs.” The factors include: Book to Price Earnings to Price One Year forward Earnings to Price EBITDA to Enterprise Value Free Cash Flow to Price In 2014, its SG Value Beta index of the 200 cheapest companies globally returned 18.7%, which was broadly in line with other value-based indices. Since 2002, based mainly on back testing, it has consistently outperformed those benchmarks. (click to enlarge) Screening for “brave” deep value stocks Of course on reading the research it became very clear to us that the SocGen team had chosen a strikingly similar set of value ratios to Stockopedia.com’s own ValueRank — with which we already score over 18,000 European and US Stocks. Out in the cold… It’s pretty clear which sectors are currently out in the cold. Oil & gas producers like Ophir Energy ( OTC:OPHRY ) and oilfield services businesses like Petrofac ( OTCPK:POFCY ) and Hunting ( OTCPK:HNTIY ) have been beaten down of late. Likewise, there is a handful of industrials like Serco ( OTCPK:SECCY ), which slumped after issuing a series of profit warnings last year. Troubled cyclicals like pub groups Punch Taverns ( OTCPK:PCTVD ) and Enterprise Inns ( OTCPK:ETINY ) make the list, as does retailer Debenhams ( OTCPK:DBHSY ). Interestingly Debenhams had a ValueRank of 94 back in October 2014, but a gradual edging up in price has trimmed that back to 90. Financial stocks also feature heavily, with Standard Chartered ( OTCPK:SCBFF ) easily the largest by market cap. TSB Banking ( OTCPK:TSBBY ) is also there, as are insurance groups Friends Life ( OTC:RSLLF ) and Phoenix ( OTC:IPHXF ). Name Mkt Cap £m Value Rank Sector Standard Chartered 22,625 93 Financials Petrofac 2,627 91 Energy Phoenix 1,884 97 Financials Indivior 1,276 95 Healthcare Vedanta Resources 1,212 94 Basic Materials Serco 942.5 90 Industrials Debenhams 933.4 90 Consumer Cyclicals MHP SA 637.5 96 Consumer Defensives Deep Value is not for the faint hearted… It’s important to remember that digging around among the cheapest stocks in the market isn’t for the faint hearted. Often these companies come with uncertainty surrounding their financial strength or business viability. It was for that reason that Graham and Dodd encouraged wide diversification — a portfolio approach should harvest the deep value premium and absorb the inevitable losses. In the decades since they introduced the concept of buying undervalued stocks, numerous financial ratios have been used as a measure of what’s cheap. But rather than relying on a single measure, a value composite using several of those value factors is proving to be an effective way of navigating one of the trickiest parts of the market. Editor’s Note: This article discusses one or more securities that do not trade on a major exchange. Please be aware of the risks associated with these stocks.