Tag Archives: seeking

Higher Rates And Improved U.S. Labor Market Hold Back SLV
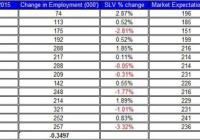
The price of SLV declined by 9% since its high a few weeks back. The recent Non-farm payroll passed expectations and coincided with the decline of SLV. The markets have revised up their expectations for a rate hike in mid-2015. The latest non-farm payroll report showed a better-than-expected result of 257,000 jobs gain in January – the market expectations were at 236,000. This news contributed to the latest fall in iShares Silver Trust ETF (NYSEARCA: SLV ), which lost 3.3% on Friday and nearly 9% from its high back in January 22nd. Here are the latest developments in the U.S. economy and its relation to the progress of SLV. The table below shows the relation between the changes in the non-farm payroll and the price of SLV in the past few reports. This time, the non-farm payroll came well above market expectations, which has led to a fall in the price of SLV. Another positive result was the revisions for December and November, which, combined, reached 147,000 more jobs than previously estimated. (click to enlarge) Source of data taken from Bureau of Labor Statistics The latest U.S. labor report also showed a higher-than-previously seen gain in wages – a 2.2% rise in hourly wages, which is the biggest gain since November 2008. This could be one of the main indicators that the FOMC has been looking for in determining its next move. If the recent rise in wages will put them on a higher path for growth, this could suggest the policy the FOMC has been implementing in recent years could come to an end within a few months. These recent positive results on both the number of jobs and gain in wages could bring the FOMC one step closer towards raising rates, which could, at the very least, curb down the rally of SLV. U.S. treasury yields have started to pick up again, which tends to move in the opposite direction to SLV; i.e. when yields rise, the price of SLV tends to decline. This was the case in recent weeks. Moreover, based on the latest update by the CME , the probability of a rate hike in the June meeting has increased to 27% – a month ago this probability was around 17.4%. For the July meeting, the probabilities are even higher at 50% compared to 37% a month back. So not for nothing, the market has also revised up its expectations for mid-year rate hike. But the ongoing economic slowdown and economic uncertainty in Europe could bring back down U.S. treasury yields. If yields were to resume their descent, as they did earlier this year, this trend could start pressuring back up SLV. In the meantime, the developments in Europe including the QE program and the tensions between the Greeks and the Germans over policy is likely to bring further down the Euro against leading currencies including the US dollar. Moreover, the recent decisions of Bank of Canada and Reserve Bank of Australia to reduce their cash rates are only bringing up the U.S. dollar. The ongoing recovery of the U.S. dollar against major currencies could start to adversely impact the price of SLV, albeit in recent weeks the correlations among major currency pairs and SLV were relatively weak, as indicated in the chart below. Source of data taken from Bloomberg The silver lining for silver bugs is that the strengthening of the U.S. dollar could also, down the line, start to weigh on the progress of the U.S. economy and taper down its growth. After all, a stronger dollar may reduce the competitive edge of U.S. exports, increase trade deficit and cut imported inflation. Therefore, if this trend persists, it may eventually start to have an adverse impact on the U.S. economic recovery, which could benefit SLV investors. The silver market isn’t an investment for the faint of heart, which is characterized with high volatility. The ongoing recovery in the U.S. economy is likely to keep pushing down the price of SLV. But from the other side, the global economic mess we face, especially in Europe, could bring down U.S. treasury yields and thus also increase the demand for precious metals. These two opposing forces are likely to keep SLV zigzagging in the near term. For more see: Is SLV about to change course? Disclosure: The author has no positions in any stocks mentioned, and no plans to initiate any positions within the next 72 hours. (More…) The author wrote this article themselves, and it expresses their own opinions. The author is not receiving compensation for it (other than from Seeking Alpha). The author has no business relationship with any company whose stock is mentioned in this article.
Mean Reversion Monkeys

Editor’s note: Originally published on February 5, 1015 The buzz has been building on this trade for weeks. Clients, friends, people on Twitter, everyone I know has been waiting for a chance to pick the bottom in oil. I’ve heard all this chatter on which triple-leveraged oil ETFs to use (I make a point of not knowing such things). They’ve been waiting for this opportunity since oil was at 80 bucks. Interestingly, they could have shorted it when it was at 80. Actually, they could have shorted it at 110. Or 100. Or 90. Or 80. Or 70. Or 60. Or 50. They could have shorted it at 50 and still made money. But they waited this entire time, watching passively as oil plummeted over 60%, to play a 10-point bounce over the course of a couple of days. Well, the mean reversion monkeys , as I call them, will tell you that they just made 20% in three days. Annualize that! Problem is, it doesn’t work that way, because you can’t flawlessly pick every bottom. I was a mean reversion monkey once, and for every time I made 20% in three days, there were three other times I almost got carried out—like that time in 2008 when I tried top-ticking the Canadian dollar. That one was painful. Have you ever heard of a CTA? CTA stands for Commodities Trading Advisor. It’s basically like a hedge fund that trades futures, but these guys are notorious trend followers. This is how John Henry, owner of the Boston Red Sox, made his money. They trade futures, they trade with leverage, and when stuff starts moving, they follow the trend. They don’t care what it is, or which way it’s going. The trend is your friend. There weren’t that many people who made money on falling oil, but the CTAs absolutely killed it. Ever notice there’s no such thing as a CMRA? A Commodities Mean Reversion Advisor? That’s because they wouldn’t make any money. The vast majority of traders and investors are mean reversion monkeys. I would place the number at well over 90%. Maybe 95%. You can make money as a mean reversion monkey, but not much. Basically, you are relying on your ability to scalp in and out of things continuously to make money. And you wonder why average hedge funds only make 5-6% a year if they’re lucky. They cut short their losers, but they cut short their winners, too. At the end of 2007, when I was still trading proprietarily at Lehman, I did an interesting exercise. I went back and looked at the P&L of every trade I did over the course of the year. I had one or two big winners, with small ups and downs everywhere else that all canceled each other out. If it weren’t for the one or two big winners, where I happened to bet big and let the profits run, I would have basically been flat for the year. In fact, I think if you analyzed anyone’s portfolio, it would look pretty much the same. In a portfolio that’s up 10%, you’re going to have one or two huge winners, and everything else will be chopped salad. The reality is that most people are only good for one or two good ideas a year. Maybe less. So wouldn’t it make sense to put as much money in those ideas as possible? Market Wizards If you go back and read your Jack Schwager Market Wizards books, and read about all the stud traders, you won’t find one of them who would be buying triple-leveraged oil ETFs for a 10% bounce in oil. No. Those guys would have had the dominant trend right. They don’t care about the countertrend, because that’s not where the money is. Trading with the trend is the only way to make meaningful amounts of money. All of Wall Street right now is doing a smug victory lap for their scalp in oil, but the funny thing about scalps is that people get greedy and, as trends often do, oil will make lower lows and people will find themselves sitting on losses instead of profits. Catching the falling knife requires so many things to go right simultaneously to work. Have you ever met someone who has money all out of proportion to his intelligence? Someone who just goes around with a horseshoe up his ass? The guy that bought Apple (NASDAQ: AAPL ) at $50 and sold it at $700. “So,” you ask this dude, “why did you buy Apple?” “It was going up.” It was going up. This is not someone who you think is particularly smart. But maybe he made $500,000 on this trade. And now he is long the iShares biotech ETF (NASDAQ: IBB ). How does he do it? How can someone so intellectually lazy be so rich? I mean, you spend hours staring at charts and watching oil tick for tick, and you timed the bottom perfectly, and you make… 10%. The Magic of Compounding Research has shown that owning equities with the dividends reinvested is about the closest you’re going to get to a sure thing in the markets. And your holding period needs to be long (like Buffett’s) so earnings/cash flows have a chance to compound. I’m sure you’ve done that exercise where you were earning 3% interest in the bank and you want to see how it compounds over time, so you stick it in an Excel spreadsheet and do the math. Same thing. If you don’t give something a chance to compound, the odds of making a meaningful amount of money are very small. Have you ever noticed that anyone who gained notoriety for being a day trader did so 15 years ago? There was no other time in history where you could literally make a living by cutting your winners short. As for being intellectually lazy, well, there’s a difference between being smart and having a psychological need to prove you’re smart, or different. What’s wrong with holding IBB if you are making money? Seems easier than buying something that hasn’t had an uptick in months. Like most sell-side guys, I was a mean reversion monkey back in the day. I’ve spent the last several years unlearning everything I had learned. Yes, investing is one of the hardest things in the world. But shockingly, it doesn’t have to be. Disclosure : At the time of writing, Jared Dillian was short CAD

Here Is Why The S&P 500 Should Not Be The Barometer Of Investor Success

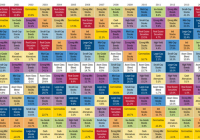
Summary The S&P 500 and the Dow are often quoted on TV and by various media outlets when providing updates on the stock market. By doing this, the media is implicitly suggesting to investors that these indexes represent how the market is actually performing. Trouble is that not everyone has the same definition of “the market” and not every investor has a portfolio that is structured like “the market” – and probably for good. Benchmarks to gauge the performance should be consistent with actual portfolio strategies as opposed to using a widely recognized stock market index, such as the S&P 500 index. Far too often, individual investors measure the success of their investment portfolios, or the effectiveness of their financial advisors, relative to the performance of a well-known stock market index such as the S&P 500 Index (“S&P 500”) or the Dow Jones Industrial Average Index (“Dow”). While it is important for investors to have a tool to measure the success of an investment strategy against, it can be very misleading, and often misguided, if an investor chooses an index as their tool that is not consistent with their risk tolerance or investment objectives. For example, the S&P 500 and the Dow are often quoted on TV and by various media outlets when providing updates on the stock market. By doing this, the media is implicitly suggesting to investors that these indexes represent how the market is actually performing. Trouble is that not everyone has the same definition of “the market” and not every investor has a portfolio that is structured like “the market” – and probably for good reason . In an Investment News article entitled, ” When underperforming the S&P 500 is a good thing ” (sign-up required), author Jeff Benjamin claims that investors have become programmed to dwell on the performance of a few high-profile benchmarks. Benjamin goes on to state that, “…a truly diversified investment portfolio should have returned less than 5% in 2014. It was that kind of year. Any advisor who generated returns close to the S&P was taking on way too much risk, and should probably be fired.” The suggestion of having the financial advisor fired may be extreme, especially if an investor has instructed their advisor to build a portfolio to try and provide performance consistent with, or superior to, the S&P 500 ( or the Dow ) and recognizes the potential risk associated with that type of strategy. However, most investors do not have this large of a risk appetite and appreciate the benefits of diversification to help deal with market volatility if and when it occurs. To this end, many of the growth-oriented investors that we speak with at Hennion & Walsh are interested in portfolios that are managed to help deliver a reasonable return while also providing for some downside protection. As a result, investors generally do not have that large of a percentage of their portfolio assets allocated to the one asset class associated with these two stock market indexes. This asset class is U.S. Large Cap. To this end, Michael Baker of Vertex Capital Advisors stated in the same previously mentioned article that, “The S&P 500 really just represents one asset class – large cap stocks…and most investors only have about 15% allocated to large cap stocks.” Having all of their investment portfolios allocated to one single asset class, such as U.S. large cap, would have rewarded investors well since the last major market crash hit bottom in March of 2009. However, this does not mean that this will always be the case going forward nor has it been the case historically. The chart below from First Clearing shows the annual returns of several asset classes from 2000 to 2014. A quick review of this chart will show how well U.S. large cap stocks have performed since 2009. Since the media focuses on U.S. large cap indexes, investors have thus been constantly reminded of how well “the market,” or more specifically U.S. large cap stocks, has done for the past 5 years. By further reviewing this chart, however, investors are also reminded that this is not always the case. U.S. large cap stocks suffered significant losses in 2008 and 2002 and additional losses in 2000 and 2001. Additionally, while large cap stocks finished in the top half of asset class performance in each of the past four years, they have only achieved this ranking once over the eleven years prior to 2011. Asset Class Returns (2000 – 2014) (click to enlarge) Source: First Clearing, LLC, 2015. Asset allocation cannot eliminate the risk of fluctuating prices and uncertain returns. Past performance is not indicative of future results. This chart is provided for illustrative purposes only and is not indicative of any specific investment. Asset class performance data based on representative indexes. You cannot invest directly in an index. Individual investment results will vary. The data assumes the reinvestment of all income and dividends and does not account for taxes and transaction costs. On the other hand, this chart attempts to illustrate the value of asset allocation with the asset class box named “Asset Class Blend” which is simply an equal weighting of all of the asset class indexes included on the chart. While I am not suggesting that such a blend is appropriate for all investors or all market environments and would likely include more asset classes and sectors to make the chart more comprehensive, the results shown in this chart still certainly demonstrate the potential benefits of diversification in down and/or volatile markets. Not inclusive of the potential fees for the implementation of each respective strategy or associated tax implications, $1,000,000 invested in large cap stocks in 2000 would have been worth $1,866,218 at the end of 2014. Conversely, the same $1,000,000 invested in this particular asset class blend strategy in 2000 would have been worth $2,831,257 at the end of 2014 based upon the annual returns listed in this Asset Class Returns table. $1,000,000 Investment Comparison from 2000 – 2014 (click to enlarge) Data source: Asset Class Returns (2000 – 2014) chart shown above in this post . Chart source: First Clearing, LLC, 2015. Asset allocation cannot eliminate the risk of fluctuating prices and uncertain returns. Past performance is not indicative of future results. This chart is provided for illustrative purposes only and is not indicative of any specific investment. Asset class performance data based on representative indexes. You cannot invest directly in an index. Individual investment results will vary. The data assumes the reinvestment of all income and dividends and does not account for taxes and transaction costs. As a result, it is imperative that investors are honest with themselves about their true tolerance for risk. If they are truthful to themselves, their risk appetite should not change based upon the current directional performance of “the market.” If an investor is not comfortable assuming the risk of “the market” or a single asset class, such as U.S. large cap, in all market environments, then they should consider the following: 1. Building ( or maintaining ) a diversified portfolio, incorporating a variety of asset classes and sectors, consistent with their tolerance for risk, investment timeframe and financial goals. 2. Utilize a benchmark to gauge the performance of their investment strategy that is consistent with (1) above as opposed to using a widely recognized stock market index, such as the S&P 500, that may not be relevant, and is likely very unhelpful, to them. 3. Try to not make critical portfolio decisions based on short term performance results but rather consider longer term performance results relative to their own overall financial goals. 4. Avoid the temptation of being influenced by media reports on general market performance to measure the success of their own investment portfolios, or the effectiveness of their respective financial advisors. Disclosure: The author has no positions in any stocks mentioned, and no plans to initiate any positions within the next 72 hours. (More…) The author wrote this article themselves, and it expresses their own opinions. The author is not receiving compensation for it. The author has no business relationship with any company whose stock is mentioned in this article.