Tag Archives: seeking

It’s Time To Get Long Volatility
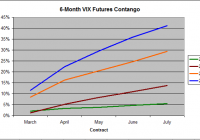
Contango-associated rollover losses have traditionally made holding volatility ETFs for more than a few weeks a dangerous proposition. Over the last two months, however, the VIX futures strip on which volatility ETFs are based has flattened reducing the expense of holding funds such as VXX and TVIX. There is an inverse relationship between VIX price and magnitude of contango. A VIX Risk/Reward score can be used to pinpoint ideal entrypoints for a buy-and-hold position in volatility ETFs. With a current value I have written multiple articles over the past 6 months- Here , Here , and Here -advocating shorting volatility ETFs to take advantage of monthly rollover losses. Recent develops in the VIX Futures market on which volatility ETFs are based, however, has made the sector more attractive as a longer term buy-and-hold position. Anybody who has traded volatility ETFs over the past five years knows that there is a constant uphill battle against the forces of contango. Volatility spikes can generate tremendous short-term gains in these ETFs, but the funds tend to underperform dramatically while awaiting these surges in volatility. While the volatility ETFs are traditionally associated with the VIX-the S&P 500 volatility index-the funds actually hold near-term VIX futures contracts. These contracts expire on a monthly basis and the fund must sell all of its front month contracts and role those funds over into the next month’s contract prior to expiration. Since the market bottom in March of 2009, these later month VIX futures contracts have been persistently more expensive than the front-month, expiring contract, a situation known as contango. This is not that surprising as volatility has been historically low as the markets have rallied these past five years keeping near term volatility low while the prospect of a future market correction has forced investors to pay premiums for later contracts. Unfortunately, this phenomenon has been devastating to short term volatility ETFs such as the iPath S&P 500 VIX Short-Term Futures ETN (NYSEARCA: VXX ) and the leveraged VelocityShares Daily 2x VIX Short-Term ETN (NASDAQ: TVIX ). Each time a fund roles over to a new contract that is in contango, it can buy fewer shares than it just sold, and over time, this results in a significant underperformance of the ETF versus the futures market on which it is based. In 2013, for example, the VIX front month futures lost 10.6% as volatility continued its decline while VXX was down a massive 62%. The 2x leveraged ETF TVIX fared even worse, down 89.8% versus a predicted loss of 21.2%. It is for this reason that I argued for shorting VXX and actively avoiding TVIX as a long term investment in previous articles. Over the past month or two, however, the VIX Futures pattern has evolved to one that I believe to be much more favorable to longer-term traders. Figure 1 below shows the % premium of each contract in the six-month VIX Futures Strip for February 2015 through July compared to the same period in 2014, 2013, and 2012. (click to enlarge) Figure 1: 6-Month Contango 2012-2015 (Source: Yahoo Finance Historical Quotes) It is clear that there has been a flattening of the VIX futures curve in 2015 versus previous years meaning that rollover losses will be limited for volatility ETFs. As of Friday’s close, holding VXX for the next sixth months would result in just a 5.5% rollover-associated loss, assuming no change to the Futures Strip. This compares to a 14% projected loss during the same period in 2014, 29% in 2013 and a disastrous 41% in 2012. Holders of the leveraged ETF TVIX can expect these losses to be doubled. However, this only tells half of the story. There is an inverse relationship between VIX future price and contango. Figure 2 below shows a scatterplot of front-month VIX price against 6-month contango using data for the past five years. As the price of the front-month VIX contract increases, the level of contango tends to decrease. In fact, once the VIX futures reach a certain level-somewhere above 20–the contacts tend slip into backwardation, the opposite of contango in which rollovers actually benefit the longs. (click to enlarge) Figure 2: Over the last 5+ Years, as VIX Futures Price decreases, Contango tends to increase (Source: Yahoo Finance Historical Quotes) At the same time, however, higher VIX levels have a much higher probability to mean revert to the average VIX level, which, over the last 5-years is somewhere around 18, as the market rallies. Figure 3 below shows the average peak six-month return based on the front-month VIX futures contract based on initial VIX starting price. (click to enlarge) Figure 3: Average Peak 6-month return by VIX range (Source: Yahoo Finance Historical Quotes) When the VIX price is less than 12, the average peak six-month return is over 100%, which stabilizes at around 35% between 14 and 20, and then slows to less than 8% when the front month VIX futures is above 30. What is needed, therefore, is a balance between a low VIX entry price while maintaining as minimal level of contango as possible. Sure, a cheap VIX may mean the possibility of a large return on a VIX spike, but you will pay for it through steep rollover losses awaiting for that singular moment. On the other hand, an elevated VIX means that rollover losses will be minimal and it will be cheap to hold the ETF for an extended period of time, but the probability of profiting from a spiking VIX will be much more limited. Overlaying the data from Figures 2-representing the expense curve-and Figure 3-representing the returns curve-produces the chart shown below in Figure 4. This graph implies that at VIX futures prices when the returns curve is greater than the expenses curve, the risk-reward profile is in favor of the longer term holder (that is, out to six-months). However, once the curves intersect at around 22, projected expenses equal projected returns and a buy-and-hold trade is no longer worthwhile. (click to enlarge) Figure 4: Historical projected 6-month return and expenses by VIX range (Source: Yahoo Finance Historical Quotes) This is a good theoretical exercise, but relies on historical averages. What does the current picture look like? A cheap VIX/low contango metric can be calculated simply by multiplying the absolute value of the contango (or backwardation) by the current front month VIX futures contract price. The lower that this number is, the greater the potential for profit while limiting rollover losses. Figure 5 below shows this VIX Risk/Reward Score over the past five years. (click to enlarge) Figure 5: VIX Risk/Reward Score Over the past 5+ years where lower values suggest favorable buying opportunities (Source: Yahoo Finance Historical Quotes) As of Friday’s closing front-month VIX Futures price of $19.18 with a six-month contango of 5.5%, the VIX Risk/Reward Score is 1.05 which, as figure 5 illustrates, is well below the 5-year average of 3.78, indicating a good risk/reward for going long volatility. Indeed, Friday’s close is in the 92nd percentile indicating a historically low score. This effectively allows us to take the projected VIX Expenses curve in Figure 4, which shows an historical average of about a 25% 6-month contango-associated loss at current levels, and shift it downward to match the current 5% projected loss. The proof, as they say, is in the pudding. The VIX risk/reward score has been

SPY 1.8% Below Record High While ECRI’s WLI Growth Rate Rises To 6-Week High

Summary On Friday the S&P500 closed at 2,055.47, 1.8% below its record high of 2093.55. SPY closed at 205.55, 2.95% below its dividend adjusted record high of 211.80. ECRI’s WLI fell slightly while its growth rate rose to a six week high. GDP grew at an average of 3.8% for the last two quarters. The most recent estimates for GDP said the economy grew at a rate of 5.0% in Q3 of 2014 then fell nearly in half to a 2.6% rate in Q4 of 2014. While the sudden drop in Q4 GDP may have surprised many analysts and the stock markets, the decline was clearly telegraphed by ECRI’s WLI growth rate. Chart 4 in my last article relating SPY to ECRI’s Weekly Leading Index, WLI, titled ” SPY Sets Another Record High While ECRI’s WLI Growth Fell To A 2.3-Year Low ” showed the growth rate for WLI falling dramatically to a 2.3 year low. Chart 4 below shows the most recent WLI data is even lower today but still well above prior lows of the economic recovery that began in 2009. On Friday February 6, 2015, for the S&P500 index at 2,055.47 was only 1.8% below its record high of 2093.55. ECRI’s Weekly Leading Index, WLI, fell to 130.8 while its growth rate rose to a six week high of negative 4.0%. SPY , the exchange traded fund for the S&P 500, closed 2.95% below its record intraday high on Friday. (click to enlarge) Chart 1 Showing S&P500 from 1997 through February 6, 2015 (click to enlarge) S&P500 Chart Scan The latest all-time high for the S&P500 put it over 32% above its 2007 high. The stock market bears who claimed we were in a “Secular Bear Market that began in March 2000″ scared many out of the stock market. Those of us who stayed in the markets and added to positions during the downturns are also well above past highs. Table 1 showing Recent S&P500 Data In my February 2011 article ” How to Play Expected Inflation from the TIPS Spread ,” I wrote I was long SPY, as one way to benefit from expected inflation. “I also believe it is a good time to own equities including SPY, the exchange traded fund for the S&P 500, for both inflation protection and income.” I have been correct to recommend SPY here on Seeking Alpha for the past few years despite ECRI’s fears of a recession. Currently, SPY adjusted for dividends is 72% above its 2000 high with dividends reinvested . The raw price index for SPY, without dividends and shown in green on my graph below, also remains far above prior highs made in 2000 and 2007. Chart 2 Showing SPY Adjusted for Reinvested Dividends. (click to enlarge) SPY Chart Scan Table 2 showing Recent SPY Data With the markets just a few percent below record highs and the WLI growth in negative territory, the current press release from the Bureau of Economic Analysis estimates Q4-2014 GDP grew at a 2.6% annual rate. On Friday February 6, 2015, the Economic Cycle Research Institute (ECRI), a New York-based independent forecasting group, released via email its latest readings for its proprietary Weekly Leading Index (WLI) for the period ending during the prior week. In the latest release, for the week ending January 30, 2015: WLI was 130.8, down compared with the prior week at 131.6 The lowest reading for WLI on record was 105.3 for the week ending March 6, 2009. WLI growth rose to a negative 4.0% compared with the prior week of negative 4.3%. This is the least negative reading in 6 weeks when it was negative 3.3% on December 19, 2014. The lowest reading for WLI growth on record was negative 29.9% on Dec. 5, 2008. It turned higher months before the stock market bottomed on March 6, 2009, at 666.79. Occasionally the WLI level and growth rate can move in different directions, because the latter is derived from a four-week moving average . Important WLI highs for the last 6 years back to January 2008 are: May 9, 2014 = 136.3 (a 6.3 year high) January 10, 2014 = 134.2 (a 193 week high at the time) April 30, 2010 = 134.9 May 9, 2008 = 134.1 Chart 3 (click to enlarge) Annual WLI growth: Based on a simple, year-over-year annualized basis, the annual change in WLI was a negative 1.9%, down from the prior week’s reading of negative 1.6%. Chart 4 (click to enlarge) In a May 9, 2014 article ” Where Are We in Economic Cycle? ” ECRI warns that sustained 3% GDP growth will remain difficult while their belief of 2% would be what the Fed calls the “stall speed.” While the consensus keeps predicting an economy at “escape velocity,” with sustained 3%-plus growth, the reality remains far short of that, with yoy GDP growth hovering around 2% – what one quickly-forgotten Fed paper had called the economy’s ” stall speed .” Meanwhile, business investment remains elusive and – as ECRI correctly predicted last summer – construction is decelerating, not accelerating, posing risks to the economy now highlighted by Janet Yellen… There’s no indication that this era will end soon, even if we see occasional 3%-plus GDP growth quarters, given that even Japan in its “lost decades” has seen 3%-plus GDP growth in 30% of the quarters since 1990. Does SPY Lead WLI or Does WLI Lead SPY? Since ECRI releases WLI numbers for the prior week, and the stock market is known in real time, you can sometimes get a clue for next week’s WLI from the weekly change in the S&P 500 or its exchange-traded fund, SPY. But this is not always the case. Specifically, in the lead up to the last two recessions, the WLI turned down months before the stock market did. Chart 5: S&P 500 vs. ECRI’s WLI Growth Rate (click to enlarge) (Note, I would plot SPY vs. WLI, but I don’t have the weekly data in my spreadsheet going back as far since I only started trading SPY in early 2007.) Over the next 10 years, I expect the S&P 500 will keep up with inflation and the dividend it pays should grow with or even exceed inflation. An added benefit to owning equities is that the dividends and capital gains currently get favorable tax treatment. Finally, Treasury rates are artificially low (see Current U.S. Treasury Rates at a Glance ) giving all bond funds significant interest rate risk. Chart 6: Screen Shot from “Rates at a Glance” Back in 2012, when ECRI was predicting a recession , I was asked in my ” Investing for the Long Term ” Facebook group why I owned SPY: “I’m confused; if the ECRI is projecting a recession, why are you long SPY? Is it a market timing strategy?” My answer was: I don’t believe in ‘all or nothing’ market timing. I explain it more in my newsletter, but I’ll adjust my allocation to stocks based on many things including ECRI’s outlook. My last two moves for SPY was to sell SOME shares earlier this year when higher and buy them back on June 4, 2012 at $127.50 using ‘Auto Buy and Sell targets’ in my monthly newsletter. Hope that helps. (Seeking Alpha requires its writers to disclose if we hold a position. Thus, I would report I was long SPY even if SPY was only 1% of the portfolio with the other 99% in cash.) What Does The Future Hold? Last week, the DOW rose 3.8% and the S&P 500 gained 3.0% compared with the prior week. Both were less than 2% below their record closing highs. This will have a positive influence on WLI for the next weekly reading. Chart 7: Excerpt from my next newsletter showing GDP by quarter: (click to enlarge) Clearly taxing savers with massive QE by the Federal Reserve to help the government spend more than it collects appears to have worked to avoid an “official recession” during the last three years. Will ECRI be correct that sustained GDP growth over 3.0% will be difficult to maintain, especially with the end of the Federal Reserve’s QE program? What do you think? Notes VOO is Vanguard’s new exchange traded fund that tracks the S&P 500 Index. It is a lower cost alternative to SPY. I own and write about SPY, as I have many years of data for it, but VOO could do slightly better than SPY over time because it has a lower expense ratio. I trade SPY around a core position in my newsletter’s ” Explore Portfolio ” and with my personal account. With dividends reinvested, my explore portfolio holds 135.933 shares of SPY with a “break-even” price of $100.26. I also have the index fund version of SPY in both my newsletter’s “core” portfolios. ECRI uses the WLI level and WLI growth rate to help predict turns in the business cycle and growth rate cycle, respectively. Those target cycles are not the same as GDP level or growth, but rather a set of coincident indicators (including production, employment income and sales) that make up the coincident index. Based on two additional decades of data not available to the general public, there are a couple of occasions (in 1951 and 1966) when WLI growth fell well below negative 10, but no recessions resulted (although there were clear growth slowdowns). For a better understanding of ECRI’s indicators, read its book, “Beating the Business Cycle .” SPY is the exchange traded fund for the S&P 500 Index. VTI is Vanguard’s “Total Stock Market” exchange traded fund. If you want to invest in a single fund, that is my first choice over SPY. I recommend SPY and several others in my core portfolios for more opportunities to rebalance. S&P500 Chart Scan & SPY Chart Scan Disclosure : I am long SPY and own the traditional index fund versions of VTI and VOO bought long ago in various taxable and tax deferred accounts. I wrote this article myself, and it expresses my own opinions. I am not receiving compensation for it (other than from Seeking Alpha). I have no business relationship with any company whose stock is mentioned in this article. Disclosure: The author is long SPY. (More…) The author wrote this article themselves, and it expresses their own opinions. The author is not receiving compensation for it (other than from Seeking Alpha). The author has no business relationship with any company whose stock is mentioned in this article.

There’s A Reason Utilities Are On The Monopoly Board, I Just Bought One

Summary Today I am going to stay on the Monopoly board and discuss a close cousin to REITs, Utilities. I see strong correlations to real estate and utilities – they both deliver essential services measured by a long runway for demand. There’s a reason utilities are on the Monopoly board… you can’t win the game by owning just real estate. Many of you know me as a real estate analyst, and while around 90% of my research is in the REIT sector, I occasionally drift outside of my circle of competence into other asset sectors. Today, I am going to stay on the Monopoly board, though, and discuss a close cousin to REITs, Utilities. You see, I need to diversify my holdings into other dividend-paying stocks, and while I’m attracted to the short and mid-term forecast for US real estate, I know it’s important not to hold all of my eggs in one basket. In addition, I see strong correlations to real estate and utilities – they both deliver essential services measured by a long runway for demand. Arguably, utilities are much more stable over the long term, as the asset class is generally consider to be the lowest-risk compared with the overall stock market. Don’t worry. I will continue my “day job” of analyzing REITs, but I wanted to write this article for two purposes: (1) I wanted to tell you about a stock I recently added to my portfolio; and (2) I wanted to provide you with the research on this selection. I recognize that the long-term capital appreciation is limited with my new stock selection; however, my reasons for the pick will be summarized below. All About Connecticut Water Connecticut Water Service, Inc. (NASDAQ: CTWS ) was founded in 1956, and is headquartered in Clinton, Connecticut. The company serves nearly 125,500 customers, which is around 400,000 people, in 56 towns in Connecticut and Maine. Around 93% of the company’s net income is attributable to regulated operations, and there are two subsidiaries: Connecticut Water Company and Maine Water Company. Around 90% of the company’s business is residential, and the business has over 2,100 miles of pipeline. Here’s a snapshot of the company’s geographic representation in Connecticut (around $297 million in revenue as of 9/30/14): Also, more recently, Connecticut Water has extended operations in Maine, where the company generated around $51 million in revenue (as of 9-30-14): Since 2012, Connecticut Water acquired around 32,000 new customers (36% growth) through investments in Aqua Maine and Biddeford & Saco Water Company. Over the last 25 years, the company has purchased 60 total water systems (40 of these over the last 7 years). The water market is highly fragmented, as the company estimates that there are over 800 separate water systems and 300 wastewater operations, making the Connecticut and Maine ripe markets for consolidation. An Incredibly Stable Dividend Alternative As I side, I focus on REITs, but I know it’s also important to maintain a diversified investment portfolio. Consequently, I decided to pursue limited exposure in the Utilities sector. I currently own Consolidated Edison (NYSE: ED ), and I have been closely monitoring Duke Energy (NYSE: DUK ) and Piedmont Natural Gas (NYSE: PNY ), both in my backyard (I live in South Carolina). Last week, I attended the World MoneyShow in Orlando, and I listened to Connecticut Water’s CEO Eric Thornburg explain his company’s business model. One of the primary attractions to his company’s business model (as he explained) is the powerful earnings platform. For example, take a look at the company’s more recent revenue history: (click to enlarge) Now compare the above-referenced income history with the earnings per share history: (click to enlarge) Perhaps the most impressive trend is the company’s dividend history – Connecticut Water has paid 234 consecutive quarterly dividends without interruption or reduction. Even more impressive than that, the company has increased its dividend payment for over 45 years in a row. (click to enlarge) Small Cap, Big Credit Rating Connecticut Water is a small-cap utility with a market cap of around $400 million. Here’s a snapshot of the company’s year-over-year trading history: (click to enlarge) As of January 2015, it is rated A by Standard & Poor’s, and as illustrated below, the company has a well-balanced debt-to-equity ratio (with no near-term debt maturities): (click to enlarge) The company has assets of around $646 million and debt of around $173 million. Here’s a snapshot of its balance sheet: (click to enlarge) Enterprise Value is around $534 million: (click to enlarge) I’m Turning on the Spigot Connecticut Water offers a compelling opportunity for investing in a conservative growth stock with a proven track record for executing accretive acquisitions. This selection is seemingly more conservative than most of the other stocks that I write about; however, I am targeting a regionally focused utility that offers diversification and scale. I was equally impressed with the management team (with an average of 25 years of utility experience), and especially the insight provided by the CEO at the World MoneyShow last week. He fielded several questions from the audience, and tactfully responded with well-articulated “sleep well at night” commentary. As evidenced by the F.A.S.T. Graph below, Connecticut Water’s historical earnings performance meets my criteria for quality: (click to enlarge) Now, let’s look at F.A.S.T. Graph’s forecasting chart (below). As you can see, the shares are trading at $36.14 (with a P/E multiple of 19.2x). Assuming a target of 21x P/E at year-end 2015, the shares could grow by ~14% (to $41.79), translating to an annualized total return of 18.75%. Of course, I have to remember that the potential for long-term share price appreciation is limited with utilities stocks. I much more confident in the dividend growth – a record that is unblemished due to the high-quality balance sheet and sound dividend payout ratio (of 59%). (click to enlarge) In closing, I know that utilities stocks tend to hold up better in falling markets, since investors are usually in less of a rush to sell their lower-risk investments when the broader environment curdles. Accordingly, remember that utilities are more risky than most asset classes within the bond market, but they are generally seen as being lower-risk compared to the overall stock market. There’s a reason utilities are on the Monopoly board… you can’t win the game by owning just real estate. The secret is to invest in a broad portfolio of dividend-paying stocks. Connecticut Water is sound utility selection that should provide me with very predictable dividend income, and by reinvesting all of the dividends, I expect to “sleep well at night”. (Remember: Connecticut Water is a small-cap stock, so investors should limit exposure). For more information on Connecticut Water’s DRIP program, click HERE . (click to enlarge) Forbes Real Estate Investor : For more information, check out my newsletter HERE . Sources : Yahoo Finance, F.A.ST. Graphs, and CTWS Investor Presentation. Disclaimer: This article is intended to provide information to interested parties. As I have no knowledge of individual investor circumstances, goals, and/or portfolio concentration or diversification, readers are expected to complete their own due diligence before purchasing any stocks mentioned or recommended. Disclosure: The author is long O, DLR, VTR, HTA, STAG, CSG, GPT, ROIC, HCN, OHI, LXP, KIM, WPC, DOC, UDF, EXR, MYCC, BX, TCO, ED, CTWS. (More…) The author wrote this article themselves, and it expresses their own opinions. The author is not receiving compensation for it (other than from Seeking Alpha). The author has no business relationship with any company whose stock is mentioned in this article.