Tag Archives: seeking

3 ETFs To Profit From The M&A Boom

M&A activity is booming this year as companies rush to beat competitors in the race to become bigger and better. As organic growth has been hard to come by, companies are trying to grow, improve margins and achieve greater synergies by taking over rivals. At current pace, 2015 appears to be on track to be the biggest year ever for M&A. Per Dealogic , US-targeted M&A reached a half-year record high of $1.03 trillion in the first half of this year, with 21 $10 billion plus deals announced so far. Global M&A volume reached $2.19 trillion in 1H 2015 – second-highest half-year volume on record, even though deal activity has remained sluggish in Europe, with weak economic growth and concerns related to political problems in Greece. Healthcare has been the most targeted sector in the US with $293.6 billion in deals – the highest half-year volume in record and up 73% from the same period last year. Technology ranks second, with $143.8 billion in deals – highest since the first half of 2000. Improving economy, ultra-low interest rates, and growing cash piles on companies’ balance sheets are the main reasons for the surging interest in acquisitions. Potential cost savings through mergers are further fueling the urge to merge in the current ultra-competitive environment. Many companies want to stay ahead in the takeover game by bulking up in order to avoid becoming targets of their rivals. As the rate hikes by the Fed are expected to be very gradual and subject to further improvement in the economy, corporate enthusiasm for deals remains high, signaling a strong second half for M&A. Below, we have highlighted three ETFs that are likely to benefit from the continued surge in M&A. Index IQ Merger Arbitrage ETF (NYSEARCA: MNA ) Merger arbitrage strategy basically aims to exploit the spread between target stock’s price after the announcement of the deal and the final takeover price. Due to the risk that an announced deal may not go through for some reason, target usually trades at a lower price until the takeover is complete. Regulatory hurdles often complicate the prospects of execution of deals, leading to the uncertainty. There are many hedge funds that play this strategy. For individual investors, the option is available through ETFs. MNA invests in companies for which takeovers have been announced and goes short on broader global equities index. It charges an annual fee of 0.76%. The product currently holds 31 companies, with Salix Pharma, Hospira and Baker Hughes being the top holdings. Looking at the performance – the product has returned 3.3% this year and 16.8% over the past three years, with very low volatility. Investors should remember that these are “hedged” or somewhat “market-neutral” strategies. Their performance is largely independent of twists and turns in the market. Further since these strategies have low correlations with stocks, they also provide some diversification benefits to the portfolio. While there are a couple more options in the space – (NYSEARCA: CSMA ) and (BATS: MRGR ) – they have failed to take off, with just $5.5 million and $6.3 million in assets respectively, exposing them to closure risk. iShares U.S. Healthcare Providers ETF (NYSEARCA: IHF ) With Aetna’s announcement last week to acquire Humana for about $37 billion, deal frenzy in the healthcare space continues unabated. It’s been a take-over battle between the five largest health insurers – United Heath, Humana, Aetna, Anthem and Cigna – as the Federal Affordable Care Act continues to reshape the healthcare market. Renewed market dynamics are forcing the companies to diversify, cut costs, gain scale and improve technologies. With the trend likely to continue in the coming months, investors should consider investing in IHF, which appears to be the best healthcare ETF to benefit from this trend. This ETF follows the Dow Jones U.S. Select Healthcare Providers Index with exposure to companies that provide health insurance, diagnostics and specialized treatment. The product fund holds 51 securities in its portfolio with United Health, Express Scripts and Cigna being the top 3 holdings. The fund has been able to attract $1040 million in assets so far. It charges 43 bps in annual fees and expenses and has gained almost 20% so far this year. SPDR S&P Semiconductor ETF (NYSEARCA: XSD ) M&A activity has been extremely hot in the Chip industry. With revenue growth slowing down , primarily due to strong US dollar, excessive inventories and the end of a PX cycle upgrade, semiconductor companies are trying to grow, expand into new markets and stay competitive by acquiring smaller players in the industry. Avago Technologies’ $36.6 billion offer for Broadcom is the largest Technology M&A deal announced on record. XSD tracks the S&P Semiconductor Select Industry Index, holding 47 stocks in its basket in almost equal weights. While equal weighting reduces the company specific risks, the product is tilted towards small cap stocks, making it more volatile than broader technology ETFs. It charges 35 bps in fees per year and is up about 6% year-to-date. Original Post
Will Iran Keep USO Down?

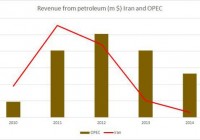
Iran’s potential nuclear deal could bring up its output in the coming years. Will this deal have a long-term impact on oil market and the price of USO? U.S. oil production keeps rising despite low rig count. The potential nuclear deal between Iran and the West, which could lift the sanctions on the country, has contributed to the decline in the price of The United States Oil ETF, LP (NYSEARCA: USO ) – the oil ETF lost over 6% on Monday and over 10% in the past month. Moreover, the weakness in China, high volatility in the foreign exchange markets over the Greek debt crisis and low oil rig counts in the U.S. also provided additional downward pressure on USO. But is Iran likely to have such a strong impact on the price of USO over the coming years? Despite the sharp rise in volatility in the oil market, the price of USO hasn’t deviated by much from the price of oil in the past couple of months – the roll decay due to the Contango wasn’t harsh. If the futures oil market keeps a low Contango or even move to backwardation, this could behoove USO investors. But the main problem remains on whether oil prices were to bounce back from its recent plunge. One factor to consider is the role of Iran in the oil market. As the EIA showed , Iran’s ability to resume its pre-sanctions oil output on the conditions of the oil fields and infrastructure – it could take time and investment to bring these fields online. Nonetheless, the potential impact of Iran’s higher output could result in low oil prices by $5 to $15 next year. These projections could be a bit too harsh considering the market conditions are harder to increase production and OPEC already exceeds its current quota. Also, the country is likely to face challenges and a more competitive oil market environment. Some of these challenges include rising oil yield of U.S. oil producers, slower growth in demand for oil in China, growing share of Saudi Arabia from OPEC’s total output, and stronger competition from Russia, which heavily relies on oil revenue and continues to face a weak currency. The market conditions have also cut down the oil exports (in U.S. dollar) of OPEC in general and Iran in particular in the past year. As I have already pointed out in the past, and based on OPEC statistical bulletin , in 2014, OPEC’s revenue from petroleum exports have gone down to $964 billion – a 12.6% fall, year on year. For Iran the revenue from output also declined, mainly between 2012 and 2013 on account of its sanctions. (click to enlarge) Source of data taken from OPEC So the potential end of the sanctions on Iran could bring back up the country’s oil revenue, even though, as presented above, the fall in revenue of OPEC also suggests it will be harder to increase oil exports in the current market conditions. Currently, Iran produces around 2.8 million barrels per day. Back in 2011, before the sanction, the country was able to produce roughly 3.6 million bbl/day – 28% higher than in 2015. Last year, it produced 3.1 million bbl per day of which only 1.1 million bbl/day were exported or 35% of total output. Over the next couple of years, assuming the sanctions are lifted, Iran could increase its total output by 700,000 bbl/day, according to the EIA . Considering the country’s energy demand keeps rising, the county is likely to partly use this added output towards its own energy needs. In the meantime, the output in the U.S. hasn’t contracted, despite the fall in rig counts in the past few months. Oil producers have also reduced their capex for 2015 and in some cases for 2016. But for now, the output hasn’t contracted and the EIA still projects the annual output will remain around 9.4 million bbl per day – only 2% lower than the current output level. (click to enlarge) Source of data taken from EIA and Baker Hughes Looking forward, the EIA estimates production will fall further in 2016 to 9.3 million bbl per day. The fall in output in the coming months could also bring back up oil prices or at the very least ease the downward pressure on oil prices. Even though Iran’s role in the oil market is very important and could have an adverse impact on the price of oil and USO, its impact could actually be less prominent considering the current market conditions and the country’s energy demands. (For more please see: ” USO Investors – Beware of The Contango! “) Disclosure: I/we have no positions in any stocks mentioned, and no plans to initiate any positions within the next 72 hours. (More…) I wrote this article myself, and it expresses my own opinions. I am not receiving compensation for it (other than from Seeking Alpha). I have no business relationship with any company whose stock is mentioned in this article.

CAF: Trading At 20%+ Discount To NAV Due To Supply/Demand Imbalance

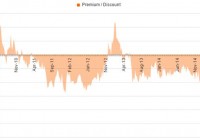
Summary Wave of investor outflows has created a significant dislocation. This provides an opportunity for those constructive on the Chinese market to obtain cheap exposure. For the rest of us, it also presents some potential to capture alpha through pair trades. Background on Closed-End Funds For those new to the space, a closed-end fund is a publicly traded investment company that raises a fixed amount of capital, and is then structured, listed and traded like a stock on a stock exchange. Whereas conventional mutual funds and ETFs frequently redeem/issue new shares to ensure that the price per share remains in line with the net asset value of the underlying holdings in the funds, this is not the case for CEFs. Rather the share price of CEFs is driven by the market forces of supply and demand, and can at times trade at either large discounts or premiums to NAV of the funds’ actual holdings. The Morgan Stanley China A Share Fund (NYSE: CAF ) is currently trading at one of the widest discounts in the CEF universe, due to a classic supply/demand imbalance. In particular, the Western media has inundated investors recently with headlines concerning the risks of a Chinese economic slowdown coupled with a potential bubble in the local equity market nearing its peak. The result is that the supply of CAF shares flooding the market from investors rushing to sell has overwhelmed demand, causing this CEF to now trade for a whopping ~20% below its NAV. In other words, for every $1 of net assets in the fund, investors now only need to pay ~80 cents to buy shares. (click to enlarge) Source: CEF Connect Morgan Stanley China A Share Fund Overview CAF is a reasonably large/liquid fund, with ~$936 million of total net asset value. The fund’s mandate is to invest at least 80% of its assets in A-shares of Chinese companies listed on the Shanghai and Shenzhen Stock Exchanges. Morgan Stanley is a longstanding/reputable CEF manager and the 3 executive/managing directors overseeing the fund each have more than a decade of experience in the Chinese market. The fund has a moderate annual expense ratio of 1.8%, and is currently relatively concentrated as shown in the table below. Also, the cash balance is now quite elevated (representing ~16% of NAV), which I view as a meaningful positive – after all, it’s hard to argue that cash in the hands of a reputable manager deserves a big discount. Plus, it gives the manager ammunition to take steps like share buybacks in the future to reduce the discount. Top 10 Holdings as of 5/31/15 % Of Portfolio Cash 16.1 Tsingtao Brewery Co., Ltd. Class A 10.0 China Resources Sanjiu Medical & Pharmaceutical Co., Ltd. Class 9.6 Industrial & Commercial Bank of China Ltd. Class A 8.7 Qingdao Haier Co., Ltd. Class A 5.2 China Pacific Insurance Group Co., Ltd. Class A 5.1 GoerTek, Inc. Class A 5.0 China Merchants Bank Co., Ltd. Class A 4.9 Kweichow Moutai Co., Ltd. Class A 4.4 Zhongbai Holdings Group Co., Ltd. Class A 3.7 Total 72.7 Source: Morgan Stanley CAF’s investor base is reasonably concentrated, with institutions holding approximately 37% of shares outstanding. Notably, Lazard holds ~$117mm or ~16% of total shares outstanding. This is also something I like to see when considering investing in a CEF that trades at a discount to NAV, as institutions holding major stakes are more likely than small individual/retail holders to pressure management to take steps to narrow the discount if this does not occur naturally over time. Source: NASDAQ So, What’s the Trade? For investors that want exposure to the local Chinese equity market, this CEF appears to be an attractive vehicle that is likely to deliver alpha from the discount reverting to more normalized levels over time. For others that have a more cautious view on the Chinese market (myself being one), there are also some potential opportunities to capture this alpha through pairing a long position in CAF with a short position in a Chinese equity ETF. There are several possible shorts to consider, but I present a couple below. CSOP FTSE China A50 ETF (NYSEARCA: AFTY ): This is a relatively small ETF with approximately $135mm of net assets. However, trading volume is reasonable, with ~$2.6mm/day in shares trading on average over the past 3 months. It is also currently relatively easy to borrow, with a cost under 2% through some retail brokers. The fund typically invests at least 80% of its total assets in the securities included in the FTSE China A50 index. This index is comprised of A-shares issued by the 50 largest companies in the China A-shares market. Direxion Daily FTSE China Bull 3X Shares ETF (NYSEARCA: YINN ): This alternative has more basis risk, but could also have the potential to produce more alpha. The fund has ~$181mm of net assets, with average daily trading volume of ~$20mm. YINN is not overly difficult to borrow, with a cost under 5.5% through some retail brokers currently. YINN seeks daily investment results, before fees and expenses, of 300% of the performance of the FTSE China 50 Index. This index consists of 50 of the largest and most liquid Chinese stocks (H Shares, Red Chips and P Chips) listed and trading on the Stock Exchange of Hong Kong, and is therefore a less tight match with CAF’s A share holdings. However, a potential benefit of shorting YINN is that one may benefit from the general tendency of levered ETFs to underperform over longer periods of time. There are several reasons for their underperformance including what is often referred to as a “leverage trap” (i.e., their tendency to decay in mean reverting markets from being forced to buy high/sell low), as well as elevated expenses that result from the higher trading activity needed to maintain these vehicles. The phenomenon is discussed in much more depth in academic literature (such as in this article ), as well as elsewhere on Seeking Alpha (such as here ). Risks/Considerations The main risk of this trade is that the timing of discount convergence is unclear, and if investors’ macro fears over China grow, there is a possibility that the discount could increase even further over the near term. The main mitigants are the facts that, as discussed above, the investor base is relatively concentrated with institutional investors, and the fund manager is reputable with dry powder in the form of excess cash to reduce the discount if it persists over time. Short selling of course also comes with added risks (e.g., possibility of force buy-ins, increasing borrow costs, etc.) and likely should not be attempted by those new to the market. Disclosure: I/we have no positions in any stocks mentioned, but may initiate a long position in CAF over the next 72 hours. (More…) I wrote this article myself, and it expresses my own opinions. I am not receiving compensation for it (other than from Seeking Alpha). I have no business relationship with any company whose stock is mentioned in this article.