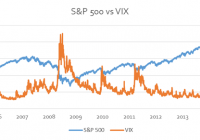
Summary VXUP and VXDN do not provide the “spot” VIX exposure as promised. VXUP and VXDN have had consistently high tracking errors. Distributions are not necessarily in cash and may be in the form of the opposing share. Volatility Products and VIX Exposure A variety of products have been developed over the years to mimic the performance of the VIX implied volatility index as well as possible. There are 3 distinct types of product available on VIX: VIX Futures – This provides indirect exposure to the movements in the index. There is a term structure in the VIX futures market. It is typically in contango. The implication of this is that long contract investors are paying a premium to contract sellers for portfolio insurance. The term structure will switch to backwardation when there are market sell-offs because VIX is mean reverting; this means that the VIX will drop and investors need to be compensated for the expected drop in the form of lower prices. It is important to note that the term structure will not be flat – this is akin to free insurance, and we all know there ain’t no such thing as a free lunch. VIX Options – This variety of call option performs excellent as portfolio insurance, because they capture the positive upside and are capped on the downside. It is likely that the option premium should reflect this, however, they are relatively illiquid. VIX-derived Exchange Traded Products – Products such as the iPath S&P 500 VIX Short-Term Futures ETN ( VXX) are ETFs based on VIX futures and therefore seek to mimic the futures market results. They are suitable for investors who are prevented by their mandates to invest in derivative products. However, it is worth noting that the significant issue with these products is that they necessarily lose out due to roll yield. A negative roll yield plagues markets in contango, where near futures are cheaper than further futures. The VIX futures market is generally in contango. These products should be held for short-term, tactical trades. Realized vs. Implied Volatility There is a significant body of literature on the subject and linkages between realized and implied volatility. Realized volatility is the actual average annualized volatility which occurred over a certain period. Implied volatility is the volatility that market expects to occur over a time period. Historically, implied volatility overestimates subsequent realized volatility. The implication is that there is a “volatility risk premium” in the options market – participants selling put options demanding more than fair value for the risk of providing portfolio insurance. What is the link between this and VIX? VIX is calculated from a wide range of option prices; it represents the market’s broad estimate of implied volatility. Thus, it also represents the market’s expectation of future volatility. This is why it is used as the “market fear gauge”. The value of VIX is driven most heavily by at-the-money put options on the S&P 500 Index. S&P 500 put options are a very simple manner in which to obtain portfolio insurance. One purchases the put option at the current level; if that market falls below that level, your portfolio drops as well, but you profit from the put option. Now, sellers of these options are effectively providing insurance to investors. How has volatility behaved over the last decade or so? The weeks where there were market drops of between 5% and 10% are tabulated below: Week Return VIX Performance 26 February 2007 – 5 March 2007 -5.19% 76.05% 8 August 2007 – 15 August 2007 -6.06% 42.98% 31 December 2007 – 8 January 2008 -5.32% 13.02% 14 January 2008 – 22 January 2008 -7.47% 35.41% 10 September 2008 – 17 September 2008 -6.14% 47.72% 22 September 2008 – 29 September 2008 -8.34% 38.02% 16 December 2008 – 23 December 2008 -5.48% -14.03% * 8 January 2009 – 15 January 2009 -7.25% 19.83% 27 February 2009 – 6 March 2009 -7.03% 6.43% 19 January 2010 – 26 January 2010 -5.05% 39.65% 30 April 2010 – 7 May 2010 -6.39% 85.71% 17 May 2010 – 24 May 2010 -5.57% 24.25% 25 June 2010 – 2 July 2010 -5.03% 5.57% 26 July 2011 – 2 August 2011 -5.85% 22.54% 15 August 2011 – 22 August 2011 -6.70% 33.17% 16 September 2011 – 23 September 2011 -6.54% 33.15% 26 September 2011 – 3 October 2011 -5.48% 16.48% 16 November 2011 – 23 November 2011 -6.07% 1.40% 8 October 2014 – 15 October 2014 -5.40% 73.73% *This is an outlier – VIX was coming off of its historical high. It has a mean reversion property. We can see that, for our narrowed down dataset, we can generally associate large VIX returns with relatively large market corrections. There is, however, no increasing/linear relationship here. This is probably due to mean-reversion property of the VIX itself. AccuShares VXUP and VXDN Recently released, the AccuShares Spot CBOE VIX Up Shares ETF ( VXUP) and the AccuShares Spot CBOE VIX Down Class Shares ETF ( VXDN) products seek to provide investors with a 1-month exposure to the pure VIX index. This is difficult because one cannot own a unit of volatility. Indeed, attempting to replicate the VIX index is a complex and costly exercise. How Does It Work? The total fund is effectively split into two separate funds that mirror one another. The “Up” and the “Down” fund. The assets in the fund are not related to volatility and are based entirely on U.S. treasury securities. The manner in which they achieve spot exposure is by simply offsetting the Up and Down shares against each other. Thus, the two move in the completely opposite direction. This means that they have created a zero-sum game and cannot lose. Only the investors can lose. If the VIX Index value is 30 or below as of a distribution date (which is basically a reset date) then a Daily Amount of 0.15% is subtracted from the Up fund and accrued to the Down fund. This works out to 4.5% monthly decay on being long volatility. You can think of this as a negative roll yield you would incur in the futures market. There are a variety of distributions which are paid to the investor and form the return. Regular Distribution – The intrinsic value of the Up and Down share match the percentage move of the VIX index over the 16th to 15th of every monthly cycle. Now, whichever fund wins, gets a distribution equal to the difference between its final value and the losing funds value. Then, the intrinsic value for both funds is set at the value of the losing fund. So the investor loses in capital gains what he gains over and above his return. The analysis of tax implications is a separate discussion. Special Distribution – The maximum gain in any month is capped at 90% to protect Down share investors from losing their entire investment. If any gains more than 75%, then there is a special distribution, which is simply an immediate distribution with the same rules as the regular distribution. Corrective Distribution – This occurs when the tracking error between intrinsic value and the market price is greater than 10% for 3 consecutive trading days. What happens is that the fund issues the equivalent number of the opposite shares to all investors, effectively resetting the fund values. For instance, say an investor hold 2 Down shares. After the corrective distribution, they will hold 2 Down shares and 2 Up shares. The value of each share is then also halved, ensuring that the investor is back at the intrinsic value they are entitled to. Does this imply that market prices should adjust back to intrinsic value after a Corrective Distribution? Not necessarily. The Issues It is claimed that the Authorized Participants will utilize arbitrage trades to keep the market prices in line with intrinsic value. The arbitrage trade is as follows: If market prices are higher than intrinsic value, purchase more primary shares from the ETF provider, and sell them in the market. The increased supply will reduce the market price and move prices in line. A similar argument holds for the reverse. Why will this not work? The futures market guarantees that there will always be a premium/discount for these shares, and this depends on the degree of contango in the market. It goes even further than this; the market price as of the 11th of June 2015 of the VXUP share is trading at a 12.95% premium to its intrinsic value, the contango between front-month and the closest back-month future is 11.72% (as of 11 June 2015). As an example of why this is so, think of a simple VIX futures market that is in contango (standard situation). This means that purchasing near-term futures are cheaper than longer-term futures. It also means that futures prices are above the spot price. VIX futures prices will converge toward the underlying index value at maturity. Consider the case where the VXUP share has intrinsic value equal to the VIX underlying value (this is a simplifying case) and it is trading in the secondary market at intrinsic value. If you purchased the share, and shorted the front-month future, you would make a positive amount right now (because the future is more expensive than spot). In the future, you would simply deliver the share you are holding that trades at intrinsic value (which is necessarily the VIX index value at that time). Thus, for no future loss and positive gain now, you have found an arbitrage opportunity. If market participants exploited this opportunity, they would bid up the price of VXUP to more than its intrinsic value, introducing the premium. And, this premium would equal the degree of contango. If one factors in the Daily Amount, it simply reduces the return on the VXUP share and reduces the premium the market impounds into the price of VXUP, by the exact Daily Amount. Thus, the Authorized Participants and the market are at odds. The sum of the premium and discount should sum to zero, however, will not disappear because AccuShares requires the shares to be created in pairs. Why are these premiums an issue? The primary issue around these premiums relates to the corrective distribution. Remember, a corrective distribution occurs if there has been a consistent premium of 10% for 3 consecutive days. The corrective distribution then does a stock split and issues the other share class. The issue is reinvestment fees that would be incurred from these distributions. One would end up with the opposite share to what is desired at the end of a period and this would then need to be sold at a discount to what you should get at intrinsic value, resulting in a loss. And brokerage fees. Conclusion The problem of tracking VIX returns is not a new one. Products such as VXX sap investor funds due to their negative roll yield. A variety of other structural issues limit their effectiveness. While VXUP would provide exposure to the VIX index, it does it at considerable cost (4.5% a month if the VIX is below 30) and risk (corrective distributions incurring trading costs). An additional risk in the product is that the prospectus does not guarantee regular distributions will be provided in cash – they may be issued in paired-share equivalents to maintain fund liquidity. From the prospectus: ” Regular and Special Distributions will ordinarily be made in the form of cash during the first six months of trading in the Fund’s shares. Thereafter, the Fund will pay all or any part of any Regular or Special Distribution in paired shares instead of cash where further cash distributions would adversely affect the liquidity of the market for the Fund’s shares or impact the Fund’s ability to meet minimum asset size Exchange listing standards. All payments made in paired shares shall be made in equal numbers of Up and Down Shares. To the extent a share distribution would result in the distribution of fractional shares, cash in an amount equal to the value of the fractional shares will be distributed rather than fractional shares. ” Waiting on the sidelines and seeing how the fund deals with corrective distributions and tracking errors is the best course of action at the moment. I would like to credit Vance Harwood’s blog post over at Six Figure Investing for aiding in the research of this instrument. Disclosure: I/we have no positions in any stocks mentioned, and no plans to initiate any positions within the next 72 hours. (More…) I wrote this article myself, and it expresses my own opinions. I am not receiving compensation for it. I have no business relationship with any company whose stock is mentioned in this article.