Tag Archives: seeking

The End Of The 30-Year Bull Market For Bonds: Mitigating Portfolio Risk In A Rising Rate Environment
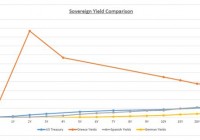
In a rising rate environment an investor should maintain a fixed income allocation, but with caveats. According to history, equities are a good investment option during certain rate hike cycles. Investing in private investments and flexible bond and alternative strategies is a good way to reduce portfolio volatility. The current investment climate presents some unique challenges for investors given the uncertain geopolitical environment, eurozone concerns surrounding Greece, and conflicting monetary policies between the U.S. and much of the rest of the world. Speaking of the latter, investors have been anticipating a rising interest rate environment within the U.S. in accordance with signals from the Fed to likely begin in late 2015. The commencement of quantitative easing (QE) in the eurozone in January and a loose monetary policy in Japan have driven down rates outside of the U.S., making U.S. yields generally more attractive than the rest of the developed world. Please look at chart 1 for interest rate differentials between the U.S. and other sovereign markets. Such a divergence makes little intuitive sense from a credit risk perspective and creates a conundrum for investors. Does an investor buy U.S. yields that are relatively higher yet likely to move even higher, or invest in Europe where the credit might be risky, but appreciation more likely due to QE? Further, how should investors view equities in the context of rising interest rates? Chart 1 (click to enlarge) Source: Bloomberg First, let’s examine the fixed income conundrum. Yes, it is likely that bond investors will experience price declines when the Fed begins the next rate hike cycle. Despite this risk, we argue that conservative investors should maintain some exposure to U.S. dollar denominated high-quality fixed income investments since these vehicles tend to weather market volatility well when investors are fearful; remember negative T-bill yields during the 2008 financial crisis! The aforementioned yield differentials should make the decision to move money to U.S. Treasuries much easier in such a scenario, but ideally investors should hold these positions via separate accounts, individual holdings, or through high-quality, short- to intermediate-term bond funds and ETFs. While it is true that separately managed accounts will decline in value like other bonds, investors will experience only paper losses unless sold, and short dated bonds will redeem at par and reinvest at the higher rates. In terms of bond funds and ETFs, using high quality, short-intermediate dated paper should help to control rate risk and to mitigate potential liquidity problems in the event of forced selling to meet redemptions. Turning to equities, it might be instructive to view stock market performance during previous rate hike cycles. First let’s look at correlations between weekly stock returns and interest rate movements, which are shown in chart 2. Going back to 1963, when 10-Year Treasury yields were above 5% and rising, there was generally a negative relationship between yield movements and stock prices. When yields were below 5%, however, an increase in rates was generally associated with rising stocks prices, reflecting a positive economic environment with generally modest inflation, which should be good for overall corporate profitability. Chart 2 (click to enlarge) Comparing today’s environment with previous cycles, we turn to chart 3, which shows the historical impacts of rate increases. While each cycle displays unique characteristics and circumstances, we would argue that the June 2004-July 2006 period was most reflective of today’s environment. We were at artificially low rates after emerging from a crisis, and while inflation in 2004 was higher than it is today, it was still modest by historical standards. Looking at the green line, while the S&P 500 exhibited some volatility along the way, the trend was generally positive during this 2004-2006 period. A key difference between today and 2004-2006, however, is in corporate earnings volatility. While P/E ratios were similar in both periods (in the 18 range), after a six-year bull market the current and future earnings outlook remains much more uncertain and volatile than was the case in 2004-2006. Chart 3 (click to enlarge) Considering the current environment and the comparison to previous rising rate cycles, how should investors adjust their portfolios to enhance returns and mitigate volatility? While there has been a significant shift toward maintaining maximum liquidity after the 2008 financial crisis, we believe investors should consider initiating or increasing exposure to private and/or alternative investments to diversify away from the volatility of public markets (both equity and fixed income) to reduce correlation among asset classes. For those investors choosing to maintain maximum liquidity, consider investing in flexible fixed income or ’40 Act alternative mutual funds focused on absolute return, not market benchmarks. Additionally, despite the likely scenario of rising rates in the U.S., maintain at least some exposure to high-quality U.S. fixed income based on global interest rate differentials and as a portfolio safe haven. Finally, be willing to hold some cash as it will act as both a buffer, as well as a means for replenishing the marginal liquidity given up in the private markets. Disclosure: I/we have no positions in any stocks mentioned, and no plans to initiate any positions within the next 72 hours. (More…) I wrote this article myself, and it expresses my own opinions. I am not receiving compensation for it. I have no business relationship with any company whose stock is mentioned in this article.
3 Top REIT ETFs Battle It Out, With Some Surprising Results

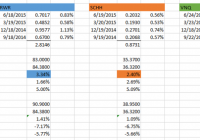
Summary REITs can enhance your core portfolio by helping you diversify into an added asset class. In this article, we will examine three worthy competitors, examining both their similarities and differences. Along the way, the author will have a preconceived notion disturbed, and discover some surprises with respect to recent performance. Now that I have spent a little time covering some basic core ETFs with which to build a simple, though well-diversified, portfolio , I thought I would branch out into an asset class that you may wish to consider as an added component. That asset class is REITS. For a little background on REITS, as well as a link to further reading if desired, feel free to check out this article on my personal blog. Presenting The Competitors In doing some research in preparation for this article, I consistently encountered information featuring three ETFs as preeminent contenders in this space; the Vanguard REIT Index ETF (NYSEARCA: VNQ ), the SPDR Dow Jones REIT ETF (NYSEARCA: RWR ), and the Schwab U.S. REIT ETF (NYSEARCA: SCHH ). I listed them in the order I did based on some commonalities I encountered in my research. VNQ is often described as sort of the pre-eminent player in the field, the “big daddy” if you will. With an inception date of 9/23/04, 145 REITs in the portfolio, $23.7 billion in Assets Under Management (AUM) , a low .12% expense ratio, and great daily trading volume leading to a wonderful average price spread of .01%, there are many reasons this ETF has been described using terms such as “the king” and “top of the charts.” RWR , in contrast, might be termed the “grand old man.” This venerable ETF is the oldest of the three, with an inception date of 4/23/01. RWR features 94 REITs in its portfolio. It has approximately $3.1 billion in AUM , an expense ratio of .25% and an average price spread of .03%. SCHH might be thought of as the “new, but competitive, kid on the block.” With an inception date of 1/13/11, it has only been around a little over 4 years. It features 95 REITs in its portfolio. It is also the smallest of the three, with $1.3 billion in AUM . Due to its smaller size and lower daily volume, it has a price spread of .05%. But here’s the kicker. Though it tracks the same index as RWR, it does so with an incredibly low .07% expense ratio. That’s right, not only does it handily beat out RWR in this area, but it also beats the much larger VNQ! Similarities and Differences As you might quickly gather, VNQ is the obvious winner in terms of greatest diversification. VNQ tracks the MCSI US Reit Index , which contains 144 constituents, whereas both RWR and SCHH track the Dow Jones U.S. Select REIT Index , which contains 92 constituents. One similarity is that the Top-10 holdings are almost exactly the same in all 3 ETFs; with General Growth Properties (NYSE: GGP ) just slipping out of the 10th spot in VNQ, replaced by Vornado Realty (NYSE: VNO ). However, here are two data points that highlight VNQ’s greater diversification. Simon Property Group (NYSE: SPG ) is the top-weighted holding in each ETF. However, while it comprises 9.83% of both RWR and SCHH, it only comprises 8.39% of VNQ. Clearly, how SPG performs will have a greater effect on RWR and SCHH. As of the latest published data, the total weight of the Top-10 holdings in RWR and SCHH is 44.63% and 44.61%, respectively. In contrast the total weight of the Top-10 holdings in VNQ is a lower 36.4%. In terms of sectors, all three track fairly closely, with a slightly higher percentage of residential REITs being featured in RWR and SCHH; approximately 20.2% vs. 17.3% in VNQ. This is offset by a slightly higher weighting in specialized REITs in the index tracked by VNQ. Recent Performance – And A Few Surprises To be honest, I came into this evaluation with somewhat of a preconceived notion. Perhaps you are already sensing it, from what you read above? I sort of felt like VNQ was going to be the runaway winner. I mean, its size, better diversification (including smaller REITs), great expense ratio, what could be better? The fact that I own VNQ in my own portfolio perhaps contributed to my viewpoint (bias?) as well. But then I started to dig into some numbers over the past year. I looked at the dividend distributions for each fund and compared them against the respective share prices. Something interesting leaped out at me right off the bat. Have a look at the picture below: (click to enlarge) First of all, you might note that VNQ (highlighted in green) is the winner as far as dividend distributions over the past year, at 4.08%. “Yep, pretty much confirms that VNQ is the king,” I proudly thought to myself. But then something caught my attention with respect to RWR (in blue) and SCHH (in brown). Both ETFs track the same index, yet RWR returned almost a full percentage point more in dividend distributions! How could that be? I next started wondering how the comparative share prices had performed over that period? In other words, was there a greater increase in the share price of SCHH that would offset the higher dividend paid by RWR? And that’s when the surprises started. Have a look at this 1-year chart: RWR data by YCharts The first item that jumped out at me was that SCHH’s share price had appreciated by 2.69% over that year, compared to 1.66% for RWR. Not only did that offset the larger dividend, in terms of total return it meant that SCHH outperformed RWR, 5.09% to 5.00% (you can see that back on the spreadsheet). That didn’t necessarily surprise me so much, as SCHH carries a lower expense ratio. You’re probably already noticing the second surprise, aren’t you? VNQ’s share price performance substantially trailed the other two; losing .20% over the period. Surely the greater dividend compensated for this? Sorry, it didn’t. To my great surprise, VNQ came in dead last in terms of total return. “Perhaps,” I thought, “this was just an aberration, something about the timing.” So I ran the same chart, but YTD through June 30. Here it is: RWR data by YCharts The first thing you will likely note is that the entire REIT sector took a pretty big hit between approximately February and June. The second thing you might note, though, is that the order of performance is the same. SCHH actually performed the best (in this case, losing the least), followed by RWR, with VNQ once again bringing up the rear. Have another look back at the spreadsheet. Even with its larger Q1 and Q2 distributions, VNQ still trails the pack in total YTD return. OK, last picture, I promise. The REIT sector has actually staged a nice comeback in July, so I thought I would see how this has played out for our 3 competitors: RWR data by YCharts Interestingly, this time the order is precisely reversed. VNQ is the strongest, with RWR in the middle and SCHH bringing up the rear. Summary & Conclusion Along the way, this became quite the interesting exercise for me, and reminded me to take nothing for granted, but instead to dig into the numbers, ask questions about details that did not appear to make sense, and follow the trail wherever it lead. At the end of the day, I’m going to call this one a tie between VNQ and SCHH. Ironically, during this latest downturn, it would appear that the smaller REITs in VNQ’s portfolio actually hurt its performance. Still, I like VNQ’s extra diversification, size and tradeability, low .12% expense ratio, and lengthy track record. At the same time, SCHH is a worthy competitor. Though not having as extensive a track record, it sure appears that Charles Schwab has succeeded in offering a quality, competitive ETF in the REIT space. That low .07% expense ratio is not to be ignored, particularly if one is a long-term investor and the slightly higher price spread is not a concern for you. And, with 95 REITs in the portfolio, it certainly offers solid diversification. RWR comes in last in my view simply because it appears clear that SCHH’s lower expense ratio is giving it a slight edge in performance. Still, if one currently holds RWR, I don’t see any particular need to sell it in favor of either VNQ or SCHH, particularly if this would create a tax impact due to unrealized gains. One last thing, if at all possible it is preferable to hold REITs in tax-deferred accounts. Since REITs receive preferred tax status as entities, their dividends are deemed non-qualified to the investor, meaning they do not benefit from the lower “qualified” dividend tax rate granted to firms that are double-taxed. As an investor, this means that you would pay tax at your highest marginal tax rate . Disclosure: I am/we are long VNQ. (More…) I wrote this article myself, and it expresses my own opinions. I am not receiving compensation for it (other than from Seeking Alpha). I have no business relationship with any company whose stock is mentioned in this article. Additional disclosure: I am not a registered investment advisor or broker/dealer. Readers are advised that the material contained herein should be used solely for informational purposes, and to consult with their personal tax or financial advisors as to its applicability to their circumstances. Investing involves risk, including the loss of principal.

4 ETFs For The Long Term Investor

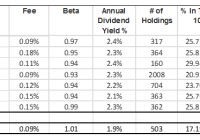
Summary A diversified portfolio can be replaced by an ETF investment strategy. Out of list of many dozens there are quick ways to filter out the best in class ETFs. Here is a list of my top 4 ETFs to choose from for the long term investor. A good friend came to me with a request. He has been managing his father’s investments for a while now and considers switching his strategy from a direct stocks picking investment to a ETF investment. He said that he would consider a shift only if the management fees will be very low and as long as the ETF would invest in big U.S. companies. I took on the challenge to find 3-5 ETFs for his consideration as replacement to a wide spread portfolio of big American corporations. He will probably choose only one or two. The first step was to create a list of Large Cap equities ETFs using ETFdb.com . The initial list included 66 Large Cap Value ETFs based on the proposal of the website. My benchmark is the S&P 500 index which is represented by the SPDR S&P 500 Trust ETF (NYSEARCA: SPY ). The full list of ETFs can be found here . My first step was to find the ETFs that charge minimum fees. My benchmark ETF, SPY, carries 0.09% of fees therefore I filtered out all ETFs that held fees that are higher than 0.2% per year. This screening proved to be very productive, as out of initial list of 66 ETFs I was left with only 15. The next step was to look at the performance demonstrated by the ETFs. SPY delivered ~65% return during the last 3 years. I therefore filtered out the ETFs that delivered less than 60% in the last 3 years. This screening allowed to narrow the list from 15 to only 7 ETFs. The last 7 were: Vanguard Value ETF (NYSEARCA: VTV ) iShares S&P 500 Value ETF (NYSEARCA: IVE ) Vanguard Mega Cap Value ETF (NYSEARCA: MGV ) iShares Core U.S. Value ETF (NYSEARCA: IUSV ) Vanguard Russell 1000 Value ETF (NASDAQ: VONV ) Vanguard S&P 500 Value ETF (NYSEARCA: VOOV ) SPDR S&P 500 Value ETF (NYSEARCA: SPYV ) The next table captures the top seven information: All of the seven are following a similar group of big corporations, nevertheless I tried to narrow the list even further. I mapped the Top-10 holdings of the seven ETFs. The next table captures the percent of holding in each ETF of its highest ten holdings: This mapping allowed me to understand that the high similarity between these ETFs. For example, VTV and MGV had the same list of top holdings. VTV delivered 2.5% higher return in the last three years and charges a slightly lower management fees. I therefore prefer VTV over MGV. VTV delivered a 10% dividend growth rate in the last three year, going from $1.40 per share in 2011 to $1.87 per share in 2014. In 2015 the two paid dividends summed to $1.01 hence we can expect this year to demonstrate a growing dividend as well. IVE, VOOV and SPYV carries the list of Top-10 holdings as well. The internal holdings percentage allocation is also very similar between these three. SPYV is different from the other two in its high Beta to the market. IVE charges a higher management fee compared to the other two. The means that the best choice out of these three is VOOV . VOOV delivered a 17% dividend growth rate in the last three year, going from $1.10 per share in 2011 to $1.78 per share in 2014. In 2015 the two paid dividends summed to $0.94, hence we can expect this year to demonstrate a growing dividend as well, even though not in the same rate as in the past three years. IUSV and VONV also carries the same list of top 10 holdings. IUSV holds substantially higher number of stocks compared to the other ETFs. The total return of this fund was lower than VONV. Therefore, VONV is good even though it charges slightly higher management fees. VONV delivered a 16% dividend growth rate in the last two years, going from $1.43 in 2012 to $1.92 in 2014. In 2015 the two dividends totaled to $0.88, so there is no indication that the growth rate will continue as in the past two years. My benchmark, SPY, was found to be a pretty reasonable investment as well compared to the other ETFs in the list. The low fees and highest return are clearly better than the others but the dividend yield is slightly lower compared to VTV, VONV and VOOV. Yet, SPY invests in a more diversified type of companies and not only in large cap value stocks. Conclusions: Based on the request for a list of 3-5 ETFs to choose from that can replace a portfolio of big cap U.S. companies my picks are: VTV, which seeks to replicate the MSCI U.S. Prime Market Value Index. VOOV, which seeks to replicate the S&P 500 Value Index. VONV, which seeks to replicate the Russell 1000 Value Index. All three have delivered a dividend growth in the last two-three years and charge minimal management fees. If willing to expend the exposure to medium and smaller companies, SPY can also be considered as it seeks to replicate the S&P 500 Index. Disclosure: I/we have no positions in any stocks mentioned, and no plans to initiate any positions within the next 72 hours. (More…) I wrote this article myself, and it expresses my own opinions. I am not receiving compensation for it (other than from Seeking Alpha). I have no business relationship with any company whose stock is mentioned in this article. Additional disclosure: The opinions of the author are not recommendations to either buy or sell any security. Please do your own research prior to making any investment decision.