Tag Archives: seeking-alpha

3 Investments Jeffrey Gundlach Loves In 2015

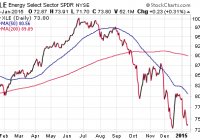
Summary This article summarizes Jeffrey Gundlach’s “2015 Market Outlook” webcast. He spoke favorably about the underlying fundamentals in the strong U.S. dollar despite its rapid ascent last year and how currency trends can be “persistent and long lived”. Gundlach also spoke favorably about gold as a flight to quality instrument. Yesterday I listened to Jeffrey Gundlach’s “2015 Market Outlook” webcast along with much of the financial community. Gundlach has certainly peaked in his notoriety as one of the most prestigious bond fund managers and continues to draw fascination for his timely insights into global economic machinations as well. For full disclosure: I have owned the DoubleLine Total Return Fund (MUTF: DBLTX ) for myself and my clients for many years now as well as various other Doubleline funds along the way. I have found Gundlach’s team focus on security selection, duration exposure, risk management, and overall total return to be a far more attractive value proposition than owning a passive index such as the iShares U.S. Total Bond Market ETF (NYSEARCA: AGG ). One of the themes that Gundlach noted throughout his call is that the U.S. consumer is focused on the positive impact of the oil space, while Wall Street has yet to fully embrace the impending negative aspects. He noted that currently 35% of the S&P 500 capital expenditures are represented in energy companies, of which there is a probability this spending could completely evaporate later this year. That could ultimately lead to employment cuts, potential bankruptcies for leveraged energy companies, and deeper impact across the high yield bond spectrum. The Energy Select Sector SPDR (NYSEARCA: XLE ) has certainly been pricing in some of those eventualities as it continues to decline with crude oil prices. Despite some modest rallies, XLE now stands at more than 25% off its 2014 high and recent probed down to new lows as angst sets in. The one thing I have noted recently is how much buying has been on throughout the energy complex since the decline began. At this juncture you would typically expect widespread distribution rather than accumulation in energy ETFs. He also spoke favorably about the underlying fundamentals in the strong U.S. dollar despite its rapid ascent last year and how currency trends can be “persistent and long lived”. However, he candidly stated that “I know it’s a crowded trade. I’m as uncomfortable as everybody else.” The PowerShares U.S. Dollar Bullish Fund (NYSEARCA: UUP ) has been a big mover as declines in the euro and Japanese yen continue to fuel a flight to the dollar. The overarching themes of lackluster growth and quantitative easing efforts in these foreign developed countries make the U.S. dollar, and concomitantly U.S. treasuries, an attractive trade for overseas dollars. Gundlach also spoke favorably about gold as a flight to quality instrument. He thinks that gold will move higher as the stress to the financial system from the repercussions of oil deflation takes hold. We have already seen an uptick in the SPDR Gold Shares ETF (NYSEARCA: GLD ) since the beginning of 2015 as it comes off multiple years of heavy declines. This sector certainly bears watching as volatility in both stocks and commodities may favor investors seeking out hard assets with non-correlated returns as a hedge against other investments. On interest rates, Gundlach noted how far off economists were in predicting the outcome of the 10-Year Treasury note yield at the end of 2014. He believes that the trend in higher bond prices (lower bond yields) will continue in the first half of this year and will probably overshoot most investors’ expectations. The strong price trend in the iShares 7-10 Year Treasury Bond ETF (NYSEARCA: IEF ) has continued to stretch further than many believed possible, and has gone almost vertical since the beginning of 2015. On a relative basis the U.S. 10-Year Yield near 1.80% is still far more attractive than other developed nations in Europe and Japan. There is obviously no concern right now for a rate hike scenario being priced into the market. Instead, investors are focusing on sheltering their portfolio from low global yields and a volatile stock environment. Other bullets of caution worth mentioning: Gundlach did not speak favorably about bitcoin and noted it was virtually the worst performing asset class of 2014. (See what I did there with “virtually”?) The stock market has been positive for the last 6 years straight (2009-2014). Stocks never been up 7 years in a row since 1871. He still feel that Treasury inflation protected securities ( OTC:TIPS ) are for losers because near-term inflation expectations are actually pointing towards negative trends. He did note that they are cheap on a relative basis, but the overriding argument to own them is flawed in this market. Avoid the iShares TIPS Bond ETF (NYSEARCA: TIP ) for the time being. He is “afraid of mall REITs” due to more retail sales moving online and shrinking need for conventional shopping centers. He noted that “It’s a little late to buy the Shanghai (China)” after last year’s run and that you probably don’t want to own European stocks or bonds right now. Also beware of leveraged ETFs with respect to compounding and tracking error over time. He noted the big decline in the DirexionShares Daily Gold Miners Bear 3x Shares (NYSEARCA: DUST ) for 2014, despite the fact that the Market Vectors Gold Miners ETF (NYSEARCA: GDX ) was down heavily last year as well. The Bottom Line No one man knows the fate of the markets and most will probably take these comments with a grain of salt. However, those that take a wider macro view in their investment analysis may be intrigued by some of the correlations that were noted in this presentation. Many of the observations Gundlach made in his monologue mirror our own thoughts on the market at this juncture. Our most recent January 2015 client memo outlined several salient points on interest rates, volatility, and areas of perceived value as well.

A Value Approach To Rebalancing Out Of U.S. Stocks

Summary I will present an approach to use Shiller P/E to value-adjust portfolio weights when rebalancing for 2015. Interestingly, of 13 developed and 12 emerging market countries evaluated, the U.S. is the only country currently in the top quartile of its historic P/E range. With the exceptions of the U.S., Switzerland, South Africa and Thailand, every developed and emerging market country’s P/E ratio is currently below its historic median. 2014 was unexpectedly a solid year for U.S. equities. Many predicted that the multi-year bull market would not continue, but yet the Vanguard Total Stock Market ETF (NYSEARCA: VTI ) managed a 12.6% total return. The same fortune could not be said about the Vanguard FTSE Developed Markets ETF (NYSEARCA: VEA ) (-5.7%) or the Vanguard FTSE Emerging Markets ETF (NYSEARCA: VWO ) (+0.6%). In rebalancing, I have in years past kept things simple and diligently rebalanced my stock portfolio to the same target weights (note this is not my entire portfolio – I also hold bonds, REITs, and individual value stocks): Index Stocks Wt. Total U.S. 50% International Developed 25% Emerging Market 25% The S&P 500, as mentioned in my previous article on market valuation, is ridiculously high. Using a few valuation metrics, history would suggest the U.S. market is due for a correction. I will certainly reduce my exposure to U.S. stocks, as I would normally in rebalancing. However, based on the current relative level of the U.S. market, I consider the traditional rebalancing approach of reducing my U.S. total stock position down to 50% insufficient if not foolish. I have done enough comparisons over time and cross-sectionally to sit idle. Instead I want to reduce my U.S. allocation further, while maintaining the same stock exposure. In this article, I will present an approach to use Shiller P/E to adjust rebalancing weights for value in 2015. My intent is NOT to actively manage my ETF portfolio, but instead to set periodic weights (once a year) based on market valuations and rebalance to them. I encourage your feedback on this disciplined simple mix of passive rebalancing with value investing. Country Price-Earnings ratio boxplots I credit Research Affiliates LLC for providing the historic ranges of Shiller Price-Earnings ratios for developed and emerging market countries (all countries have at least 19 years of data). The chart below shows the range of P/E ratios for U.S. versus International Developed countries in a boxplot with the current value in blue, the line representing the lower 25% and upper 25%, and the box representing the middle 50%. The countries shown represent 90.1% of the Vanguard FTSE Developed Markets ETF. Interestingly, only the U.S. is in the top quartile of its historic range. Also note in absolute level, it has the highest P/E ratio. The U.S., at 27.1 times earnings is 2.2 times higher than the next highest developed country, Japan. Since I do not have the entire distribution to calculate the current percentiles (and create an average percentile), I instead rate each country with a number 1 through 4 that represents which historic quartile its current P/E ratio stands in (from top to bottom). Thus, the U.S. scores a 1 and the portfolio weighted average score for the International Developed countries is 3.32. (click to enlarge) Next I will show the U.S. versus Emerging Market P/E ratio boxplots. Note, these countries represent 94% of the Vanguard Emerging Markets Stock Index ETF. Once again the U.S. is alone in the 4th quartile of its historic range and is has a higher P/E ratio greater than the emerging market country with the highest P/E ratio (Mexico) by 6 times earnings. Using the same quartile scoring approach as the U.S. and International Developed countries, the Emerging Market average score is 3.26. (click to enlarge) Country P/E deviations from median Next, I measure the percent deviation from the historic medians for each country. I omitted adding medians on the boxplots to avoid cluttering them. The U.S. P/E ratio is currently 70% above its historic median. With the exceptions of Switzerland, South Africa and Thailand, every other Developed and Emerging Market country is currently below its historic median. Also note, these three are only modestly above their medians (within 20%). Brazil, Russia, and Italy are all 35% below their median P/E ratios or lower. (click to enlarge) (click to enlarge) Conclusion: New Portfolio Weights Using the three quartile scores, I recalculate my new portfolio weights by ranking them with adjustments of (-10%, 0, and +10%). Since the International Developed and Emerging Market scores are so close, I give them both weight increases: Stock 2014 weights Avg. P/E Quartile Weight adjustment 2015 weights Total U.S. 50% 1.00 -10% 40% International Developed 25% 3.32 +5% 30% Emerging Market 25% 3.26 +5% 30% Total 100% 7.58 0% 100%

Sky Solar: A Less Risky Way To Invest In The Growing Solar Industry

Summary The company is benefiting from increased electricity sales and is expanding its solar park assets. Sky Solar has a strong project pipeline and is focusing on the downstream project business. Expanding fast into the Chinese market under the supervision of a new management team. I ntroduction Sky Solar Holdings Ltd. (NASDAQ: SKYS ) is an independent solar power producer headquartered in Hong Kong. The company recently got itself listed on Nasdaq and trades with the ticker SKYS. Sky Solar owns and runs various solar parks across the globe. It has developed around 200 solar parks in Japan, Greece, Bulgaria, the Czech Republic, Spain, USA, Puerto Rico, Canada and Germany, which totals ~182 MW in capacity. The company’s business model is similar to TerraForm Power (NASDAQ: TERP ), which owns solar plants and derives money by selling the electricity to utilities. As the solar industry has rapidly expanded and matured, the independent solar power producer business model has developed rapidly. The company derives its revenue components from solar system and electricity sales. Sky Solar is gradually increasing its electricity sales, while decreasing the focus on system sales. Given the company’s widespread geographic base, growing solar industry and focus on long-term electricity sales and expansion in the growing Chinese market, I would recommend adding the stock to one’s portfolio. What I like about the company 1) Increasing its presence in China – Sky Solar very recently announced that it would be entering the Chinese Solar market , which is the largest in the world. The company has strong links in China with its management being Chinese. Sky Solar has plans of building and selling solar assets to the large state owned organizations. It is specifically looking for provinces, which have a power demand-supply imbalance. Another initiative is the launch of “Sky-Link,” which is a platform for analyzing industry data related to supply chain and solar project quality control. The company also is looking at moving senior leaders to China to expedite the processes. All these initiatives will help the company penetrate the Chinese market quickly. The company also is thi nking of expanding in Japan and South America. 2) Good Q314 Performance – The company reported revenues of $10.3 million, which increased by 26.1% y/y. The highest electricity sales were in the European region and the highest solar system sales were in the North American region. Gross margin was 47.9% in Q314, as compared to 10% in Q3 2013. This was mainly due to the shift from solar energy system sales business to electricity sales. Loss per share remained unchanged at $0.01, when compared to Q3 2013. The company ended the quarter with $33.2 million in cash and cash equivalents. Total borrowings amounted to $48.1 million. “Looking ahead, we are focused on development in several key geographies where we see strong growth potential, including Japan and South America. We believe our strong foundation in the most promising solar power markets will drive our growth in 2015 and beyond – Mr. Weili Su, founder and executive chairman of Sky Solar Source: Sky Solar Revenue Mix (million $) Q3 2014 Q3 2013 % increase/ (decrease) Electricity Sales 6.9 3.2 119 Solar system and Other Sales 3.4 5 -32.4 3) Increasing Electricity sales – The company is shifting focus gradually from solar system sales to IPP electricity sales. The electricity sales increased 119% on a yearly basis, comprising 67% of the total revenue in Q3 2014. The company plans to increase its solar park asset portfolio, which will further escalate electricity sales in the revenue mix. It is always beneficial to diversify, especially in the high beta solar industry. The company’s revenues are increasing from electricity sales and it is thus benefiting from this diversification. 4) Expanding Project Pipeline – As of November 2014, the company had 1.3 GW of projects at various development stages and more than 1 GW of projects in the pipeline. Sky Solar had 18.5 MW projects under construction in Japan and a 4.1 MW project under construction in Canada. 5) Additions to the Management Team – Sky Solar announced a change in its executive management team on December 22nd, 2014. Two of the positions will take care of the company’s new initiatives in China and thus help a smooth entry into the Chinese market. The new CEO Mr. Weili Su also is the founder of Sky Solar Holdings and has served as a director and secretary of the board for Yingli Green Energy (NYSE: YGE ). The company matched the necessary skill set with the job requirement, thus lending more efficiency into the processes. The company is backed by the China Development Bank (CDB), which gave it a $1.6 billion credit line in 2012 . SKYS Risks Competition – Sky Solar competes against major solar developers such as SunEdison (NYSE: SUNE ), as well as other major power producers such as Abengoa and EDF. The company also faces competition from the likes of mainstream solar companies like Jinko Solar (NYSE: JKS ) and Canadian Solar (NASDAQ: CSIQ ) specializing in the project development business. Falling Fossil Fuel Prices – While I don’t think it is a major issue, falling prices of crude oil, gas and coal is making solar less attractive as a power source. However, governments around the world are subsidizing and pushing for solar power because of its environmentally friendly nature and energy security. India recently raised its solar target from 20 GW to 100 GW by 2022. China too has signed an agreement with the US to increase the share of renewable electricity substantially by 2030. Stock Volatility – Solar shares are highly volatile and can see sharp declines and are not for the risk averse investor. Since November, SKYS has dropped to a low of $6 and a high of $14. The company could not raise $172.5 million that it targeted with a higher valuation and had to sell less number of shares at a lower price. Stock Price and Valuation Sky Solar is currently trading at ~$10.9, which is ~30% below its 52-week high. SKYS unlike other major solar companies such as YGE, Trina Solar (NYSE: TSL ) and Jinko Solar, has not been affected too much by the sharp stock price declines. The company’s revenues are dependent more on a long-term sale of electricity, which is more stable than sale of low-margin solar panels. The company has a market capitalization of $591.4 million. Sky Solar’s forward P/E is 16.8x, while P/S is 15.4x. The P/S might look expensive when compared to other Chinese solar companies. However, one should note the company makes most of its money through electricity sales, which happens over the 25-30 year life of the solar asset. Most of its investments happen upfront, while cash flows accrue over 25-30 years. I think SKYS provides a good diversification in a solar portfolio. SKYS has declined less than the other Chinese solar stock companies, which have fallen sharply due to the oil price decline. Like other power producers, the stock has more stable earnings compared to solar panel companies. (click to enlarge) Conclusion Sky Solar is not biased towards any particular solar supplier or technology and hence can easily choose from manufacturers and suppliers to match the best technology for its projects. The company is earning revenues from the downstream project business, which is expanding rapidly. IHS estimates that global solar demand will increase between 16-25% in 2015. The Chinese market is the largest one in the world with more than 10 GW to be installed in 2015. This shows that the company has a good market to expand into. Even mainstream solar panel manufacturers such as Yingli Energy and Trina Solar are diversifying into the solar project business because it is more profitable. Sky Solar also is b enefiting from increased electricity sales in its revenue mix. I think that the company has a good business model but given the depressed valuation of its peers, investors should wait for sharp price dips (stock dropped to $6 during December). With the company’s increased focus on the Chinese market and its strong project pipeline, I would recommend adding the stock during sharp dips.