Tag Archives: seeking-alpha

Vanguard FTSE Pacific ETF Is Mostly Japanese Stocks, But It Looks Compelling

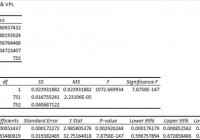
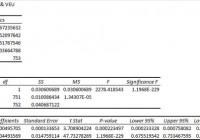
Summary VPL has a respectably low correlation to SPY and isn’t too volatile in its own right. The expense ratios are low and the liquidity is strong, but the ETF is currently trading at a premium to NAV. Despite the name, China is almost completely excluded while Japan and Australia dominate most of the portfolio. Investors should be seeking to improve their risk-adjusted returns. I’m a big fan of using ETFs to achieve the risk-adjusted returns relative to the portfolios that a normal investor can generate for themselves after trading costs. I’m working on building a new portfolio and I’m going to be analyzing several of the ETFs that I am considering for my personal portfolio. A substantial portion of my analysis will use modern portfolio theory, so my goal is to find ways to minimize costs while achieving diversification to reduce my risk level. In this article, I’m reviewing the Vanguard FTSE Pacific ETF (NYSEARCA: VPL ). What does VPL do? VPL attempts to track the investment results of the FTSE Developed Asia Pacific Index. The ETF falls under the category of “Diversified Pacific/Asia”. Does VPL provide diversification benefits to a portfolio? Each investor may hold a different portfolio, but I use the SPDR S&P 500 Trust ETF (NYSEARCA: SPY ) as the basis for my analysis. I believe SPY, or another large-cap U.S. fund with similar properties, represents the reasonable first step for many investors designing an ETF portfolio. Therefore, I start my diversification analysis by seeing how it works with SPY. I start with an ANOVA table: (click to enlarge) The correlation is about 77%, which is low enough that I’m expecting to see significant diversification benefits. Standard deviation of daily returns (dividend adjusted, measured since January 2012) The standard deviation isn’t too bad. For the period I’ve chosen, the standard deviation of daily returns was .889%. For SPY, it was 0.736% over the same period. While VPL is more volatile than SPY, the difference isn’t huge enough to prevent the low correlation from reducing portfolio risk if the level of exposure is right. Mixing it with SPY I also run comparison on the standard deviation of daily returns for the portfolio assuming that the portfolio is combined with the S&P 500. For research, I assume daily rebalancing because it dramatically simplifies the math. With a 50/50 weighting in a portfolio holding only SPY and VPL, the standard deviation of daily returns across the entire portfolio is 0.764%. If the position in SPY is raised to 80% while VPL is used at 20%, the standard deviation of daily returns drops down to 0.734%. This is slightly below the standard deviation of a portfolio that only holds SPY. In practice, I would want to limit a position in VPL to no more than 20% of the portfolio, but I’d prefer to use an amount that was still lower. The low correlation makes a very strong case for using VPL in a small position to enhance diversification. At 5%, the standard deviation of the portfolio would have been 0.733%. If an investor was only measuring risk based off the standard deviation of returns, it would appear that the 20% to 5% range was very reasonable. I’d lean towards being a little more conservative with the exposure. I think 10% to 5% is a fairly reasonable range. Why I use standard deviation of daily returns I don’t believe historical returns have predictive power for future returns, but I do believe historical values for standard deviations of returns relative to other ETFs have some predictive power on future risks and correlations. Yield & Taxes The distribution yield is 2.7%. It’s high enough that the portfolio could be included as part of an ETF portfolio designed for a retiring investor. If an investor wants to ensure they aren’t tempted to get into the portfolio, the strong yields are nice. Expense Ratio The ETF is posting .12% for an expense ratio, which is a very reasonable cost for the diversification. Unfortunately, most ETFs have expense ratios higher than I’d like to see. Clearly, VPL isn’t one of those ETFs. Vanguard funds usually have low expense ratios, which is one of the more appealing things about using their ETFs. Market to NAV The ETF is trading at a .22% premium to NAV currently. I think any ETF is significantly less attractive when it trades above NAV. I wouldn’t have expected such a significant premium on an ETF with over a million shares per day trading hands. I may need to dig deeper into the ETF to look for a reason for that premium and determine if it is normal for the ETF to trade at a premium. Aside from that premium, this is one of the better foreign ETFs I’ve seen. Largest Holdings The diversification within the ETF is pretty good. Despite the largest position being over 3%, the allocations drop off rapidly before we are even out of the top 10. I find that attractive because it ensures investors are getting some diversification benefits within the individual holdings as a benefit for paying the expense ratio. (click to enlarge) Investing in the ETF is largely relying on modern portfolio theory. The argument for the investment is the respectably low correlation of the portfolio to the major U.S. index funds. Making an investment requires a belief that markets are at least somewhat efficient so that the companies within the portfolio will be reasonably priced. Conclusion The ETF looks less volatile than many of the foreign ETFs I have been considering. I’m finding that to be an attractive factor even though there is significant correlation between VPL and the other international market ETFs. So far, VPL is easily one of the stronger contenders for the foreign exposure area in my IRA. The ETF simply does very well on several metrics. Toyota (NYSE: TM ) is a very solid company to have as the top holding. The most interesting thing I found while researching the ETF is that the exposure isn’t quite what I would have expected when broken down by individual countries. I figured Japan would be a significant part of the portfolio, but being over 50% of the portfolio is enough to concern me a little bit. Despite the strong focus on a single foreign country, the volatility has been much lower than competing ETFs with much broader focuses. Australia is the second largest representation at nearly 20%. That’s okay with me. BHP Billiton (NYSE: BHP ) is a quality company that I’d have no issue with having in my portfolio despite the terrible performance lately of mining stocks. Hong Kong is represented with 7% of the portfolio, but China is less than 1%. When I’m looking at something labeled “Asia Pacific”, I generally expect substantially more Chinese companies to be included. If I had commission-free trading on VPL so I could keep rebalancing the position for free, it would be a pretty much automatic pick for my foreign exposure. In that hypothetical scenario, I’d lean towards a 5% exposure. Additional disclosure: Information in this article represents the opinion of the analyst. All statements are represented as opinions, rather than facts, and should not be construed as advice to buy or sell a security. Ratings of “outperform” and “underperform” reflect the analyst’s estimation of a divergence between the market value for a security and the price that would be appropriate given the potential for risks and returns relative to other securities. The analyst does not know your particular objectives for returns or constraints upon investing. All investors are encouraged to do their own research before making any investment decision. Information is regularly obtained from Yahoo Finance, Google Finance, and SEC Database. If Yahoo, Google, or the SEC database contained faulty or old information it could be incorporated into my analysis. The analyst holds a diversified portfolio including mutual funds or index funds which may include a small long exposure to the stock.

Talking About Value Investing And Fed Policy (Video)

Here is the second part of my interview on RT Boom/Bust. It was recorded while the FOMC was releasing its statement, so I had no idea at that time as to what the announcement had been. The interview covers my view of Apple (NASDAQ: AAPL ) (not one of my strong points), Fed Policy, and what should value investors do in this low interest rate environment. Note that not all of my opinions are strong ones, and that in my opinion is a good thing. Often the best opinions are not controversial. If you are interested in these topics, or listening to me, then please enjoy the above video. My segment is about seven minutes long. Disclosure: None Share this article with a colleague

Vanguard’s All-World Ex-US Fund Sounds So Good, But Hasn’t Performed

Summary When I’m contemplating funds for my IRA, I like to use Modern Portfolio Theory. The risk level and correlation measured on a daily a basis are unattractive, though the correlation appears much lower in longer scenarios. Despite a great expense ratio and strong dividend yield, I have a hard time getting excited about VEU. It’s a solid ETF, but I’m less excited for it than I usually am for Vanguard funds. Investors should be seeking to improve their risk-adjusted returns. I’m a big fan of using ETFs to achieve the risk-adjusted returns relative to the portfolios that a normal investor can generate for themselves after trading costs. I’m working on building a new portfolio, and I’m going to be analyzing several of the ETFs that I am considering for my personal portfolio. One of the funds that I’m considering is the Vanguard FTSE All-World ex-US Index ETF (NYSEARCA: VEU ). I’ll be performing a substantial portion of my analysis along the lines of Modern Portfolio Theory, so my goal is to find ways to minimize costs, while achieving diversification to reduce my risk level. What does VEU do? VEU uses an indexing approach to track the performance of the FTSE All-World ex-US Index. The first thing I’m looking for is diversification. If the ETF really brings great diversification and can effectively represent all virtually all of the non-US market, then it should be an incredible fit for my portfolio. However, I want to run my own statistics to get a better feel for the performance of the ETF. Does VEU provide diversification benefits to a portfolio? Each investor may hold a different portfolio, but I use the SPDR S&P 500 Trust ETF (NYSEARCA: SPY ) as the basis for my analysis. I believe SPY, or another large cap U.S. fund with similar properties, represents the reasonable first step for many investors designing an ETF portfolio. Therefore, I start my diversification analysis by seeing how it works with SPY. I start with an ANOVA table: (click to enlarge) The correlation measured on a daily basis is higher than I would expect. Given that the ETF is expected to represent all of the non-U.S. market, I was hoping for a correlation closer to 70%. There are plenty of REIT ETFs that have lower levels of correlation. I feel like this ETF may be seeing more of a correlation to the U.S. market than it really should. I want to see low correlations, and this doesn’t seem to offer that. Since it feels wrong for there to be such a strong correlation, I decided to test the statistics against eyeballing the chart. Remember that I’m looking at statistics on a daily basis, so the influences can be money flowing in and out of the market. The image below is a 5-year price chart from Google Finance. (click to enlarge) VEU has performed quite poorly if measured over the entire period. However, it appears clear from the graph that while the correlation of daily returns is high, the overall direction of the lines is not impacted as strongly. Therefore, over a long time period, I would expect the diversification benefits to be better than they are over the short term. In the short term, the ETF moves up and down with SPY, but over the longer term, the performance is dictated by other factors. Standard deviation of daily returns (dividend adjusted, measured since January 2012) The standard deviation is higher than I would expect for an ETF that is expected to be so broad. For VEU, it is .905%. For SPY, it is 0.736% for the same period. The higher volatility, combined with high daily correlation and very unimpressive results over the last 5 years aren’t very attractive to me. I looked back at the numbers since inception, and they aren’t very attractive either. A portfolio split half and half between VEU and SPY, which I’m not recommending, would have scored a .793% for the daily standard deviation. Due to the high correlation and high standard deviation, the daily statistics don’t support the ETF offering much in the way of diversification benefits. Clearly, the long-term price chart shows that there is some substantial diversification. However, I’d be concerned if I allocated a large portion of the portfolio to it. Why I use standard deviation of daily returns I don’t believe historical returns have predictive power for future returns, but I do believe historical values for standard deviations of returns relative to other ETFs have some predictive power on future risks and correlations. Liquidity is great The average trading volume is over 2.4 million shares per day. I have absolutely no liquidity concerns. Yield The distribution yield is 3.52%. That is a fairly attractive yield. This ETF could be worth considering for retiring investors. I like to see strong yields for retiring portfolios, because I don’t want to touch the principal. Higher yields imply lower growth rates (without reinvestment) over the long term, but that is an acceptable trade-off, in my opinion. If the long-term diversification benefits and strong distribution yield encouraged retirees to keep their hands out of the portfolio, that would make the ETF substantially more attractive for investors that needed help in that regard. Expense Ratio The ETF is posting .15% for both gross and net expense ratios. For the expected diversity in the equity securities being held and the risk factors affecting the ETF, that is a very attractive expense ratio. In my opinion, .15% is a fairly attractive expense ratio, regardless of what the ETF is doing. Generally, I think anything less than .20% is doing well for expense ratios. Market-to-NAV The ETF is at a .06% premium to NAV currently. That isn’t large enough to matter for a long-term holder. Check before trading, but I wouldn’t expect to see this ETF deviate from the NAV by a meaningful amount. Largest Holdings The diversification within the holdings looks great. (click to enlarge) Conclusion I’m currently screening a large volume of ETFs for my own portfolio. I have a total of five portfolios that I am personally connected to. My wife and I both have Traditional and Roth IRAs. I also have a solo 401K. The 401K is through Schwab, so I have a preference for ETFs on the OneSource list for that account. The four IRA accounts are with a different brokerage that does offer me any incentives to pick certain ETFs. In those accounts, I will have a preference for using a smaller number of ETFs to achieve my diversification, due to trading costs. Vanguard funds are very attractive, in my opinion, for any accounts that don’t already have commission-free trading. In general, they have low expense ratios and solid diversification. I was given the impression that this ETF would be a strong contender for one or two of the IRA accounts, but so far, I’m not convinced. My current IRA uses some mutual funds that were relatively low-fee, with no trading costs. I want to make some fairly substantial changes. Over the course of a few months, the trading commission on buying into some low-fee ETFs should be covered by the lower expense ratios. The trading costs will encourage me to rebalance less frequently. That makes low volatility even more important to me. I’m stuck in a hard situation with assessing VEU. I love the idea of getting exposure to all the foreign markets with a single ETF, because it reduces trading costs. I don’t like the daily correlation values, but the long-term chart shows that the performance of the VEU isn’t as strongly tied to the S&P 500 as it would appear. For my IRAs (non-Schwab, so no OneSource), the strongest contenders so far for major positions are the Vanguard Total Stock Market ETF (NYSEARCA: VTI ) and Vanguard REIT Index ETF (NYSEARCA: VNQ ). If I can’t find an option that really appeals to me as a single ETF to cover foreign exposure in the IRAs, I may accept going without the foreign exposure. Additional disclosure: Information in this article represents the opinion of the analyst. All statements are represented as opinions, rather than facts, and should not be construed as advice to buy or sell a security. Ratings of “outperform” and “underperform” reflect the analyst’s estimation of a divergence between the market value for a security and the price that would be appropriate given the potential for risks and returns relative to other securities. The analyst does not know your particular objectives for returns or constraints upon investing. All investors are encouraged to do their own research before making any investment decision. Information is regularly obtained from Yahoo Finance, Google Finance, and SEC Database. If Yahoo, Google, or the SEC database contained faulty or old information, it could be incorporated into my analysis. The analyst holds a diversified portfolio, including mutual funds or index funds, which may include a small long exposure to the stock.