Tag Archives: seeking-alpha

Exploiting Market Inefficiency In Closed-End Funds

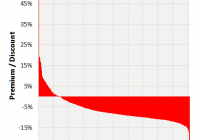
Summary Closed-end funds are widely considered to be the most inefficient of tradable securities. A recent paper examining closed-end fund discount and premium status conclusively demonstrates that mean reversion is a feature of the funds and can be the basis of a trading strategy. Mean reversion rates vary among asset classes. Fixed-income fund revert faster than equity funds. Exploiting Market Inefficiency In Closed-End Funds One of the clichés bandied about regarding closed-end funds is that they are the least efficient of investment vehicles. This should be obvious from the fact that the vast majority sell at discounts to their net asset values. By any reasonable interpretation of an efficient market, CEFs should always be selling at or near their NAVs. But such is certainly not the case. A quick look at the universe of 567 funds listed on cefconnect.com shows that 86.4% of them sell at a discount, with the median discount at -8.33%. To illustrate the point, I worked up this chart, showing the P/D distribution for all 567 funds. It illustrates just how contrary to an assumption of market efficiency the closed-end fund universe is. Premiums range from PIMCO Global Stocks Plus (NYSE: PGP ) and PIMCO High Income Fund (NYSE: PHK ) two fixed-income PIMCO funds at the high end of the scale with premiums over 60%, to lows under -30% for two tiny US equity funds, RENN Global Entrepreneurs Fund (NYSEMKT: RCG ) and Foxby Fund (OTCQB: FXBY ) at the bottom. If we take a 1% deviation from NAV as a generous expectation of reasonably efficient pricing, we find that only 5.1% of funds would even meet that loose standard. So, it seems clear that the closed-end fund market is inefficient. But it appears that it’s even more inefficient than this standard might indicate. To demonstrate I want to discuss a paper by Dilip Patro, Louis R. Piccotti and Yangru Wu titled Exploiting Closed-End Fund Discounts: The Market May Be Much More Inefficient Than You Thought . The paper, which is a bit more than a year old, only recently came to my attention. I like it because it validates an approach I’ve been using in my own investing in closed-end funds. An approach I’ve discussed and some commenters have considered to be unjustified. The authors looked at all closed-end funds. They contrasted trading strategies taken from the existing literature that bought funds with the greatest discounts and sold funds with the greatest premiums to a strategy based on an assumption of mean reversion by funds to premium/discount equilibrium levels. They began by formally testing for mean reversion of premiums and discounts for each individual fund, and showed that the majority do exhibit significant mean reversion. Results indicate a mean rate of reversion of 8.6% a month, which implies an average half-life of 7.7 months. Further, they showed significant differences among asset classes. Fixed-income funds have faster rates of mean reversion (10.4% a month) than equity funds (7.5%), and within the equity category, international funds reverted faster than domestic funds. Once they had established the significance of mean reversion in premium/discount they turned to a model arbitrage strategy based on this fact. The strategy consisted of buying the quintile of closed-end funds with the highest estimated returns and selling the quintile of closed-end funds with the lowest estimated returns. Their strategy greatly outperformed one from previous studies involving buying the most deeply discounted funds and selling those with the highest premiums. This table summarizes the results. (click to enlarge) The earlier strategy, buying funds with the lowest discounts and selling those with the highest premiums, generated an annualized mean return of 14.9 percent with a Sharpe ratio of 1.52. The mean-reversion based strategy produced an annualized mean return of 18.2 percent and a Sharpe ratio of 1.92. The chart below shows monthly results. (click to enlarge) They went on to look at commonly used risk factors and concluded that the results could not be explained by the three Fama and French factors, the Carhart momentum factor or the Pástor and Stambaugh tradable liquidity factor. Much of the math used in this study is beyond all but the most sophisticated investor (if you’re inclined to economic statistics, do check out the original paper) and not really useful for routine decision making. Nor is the strategy intended to be applicable as a practical, real-world investing scheme. Typical of academic research, it was designed to isolate and demonstrate the power of using mean reversion as a metric. Most important to a real-world investor is how an awareness of the highlights can inform decisions. Those highlights conclusively demonstrate mean reversion in discount/premium status for closed-end funds. Further they demonstrate that an investing strategy based on the expectation of mean reversion in discount/premium status outperforms strategies based on discount/premium status alone. And finally, they demonstrate that the outperformance of the mean reversion strategy is independent of five factors that might otherwise explain the enhanced return. For an investor the message is clear. First, closed-end funds are in fact the inefficient market vehicle many of us assume them to be. Second, discount/premium status, the manifestation of that inefficiency, does not, in itself, generate the greatest opportunity for exploiting that inefficiency. Third, reversion of discount/premium status to a mean value is a clear reality for closed-end funds. And finally, the market’s mispricing of closed-end funds relative to their NAVs coupled with the tendency to revert to a mean value provides exploitable opportunities. The study validates selection of closed-end funds with an eye to discounts over premiums, and historically exceptional discounts over simply using discount alone. It further validates selection of funds with exceptional deviations below their historical premium/discount status with the expectation of taking profits from the decay of the exceptional deviation. Although this was the only variable investigated by the authors, it is clearly not the sole variable one should use as a basis for choosing among CEF investments. One might, for example devise a strategy that superimposes discount mean-reversion on other factors. However one approaches closed-end fund investing, these results emphasize that it would be wise to incorporate this factor into one’s decisions. Finally, the variation noted among asset classes suggests caution in applying this element too broadly. It would seem to be most applicable to fixed-income funds and less so to domestic equity funds. For the entire study, risk-adjusted return (alpha) from the subsample of foreign funds was greater than that from domestic funds. Alpha from fixed-income funds was greater than that from equities funds. I think it’s fair to suggest that many close observers of closed-end funds have developed an intuitive sense that this is the case. They will be pleased to see their intuitions, gleaned from market observation, are validated by this careful statistical study. Editor’s Note: This article covers one or more stocks trading at less than $1 per share and/or with less than a $100 million market cap. Please be aware of the risks associated with these stocks. Disclosure: The author has no positions in any stocks mentioned, and no plans to initiate any positions within the next 72 hours. (More…) The author wrote this article themselves, and it expresses their own opinions. The author is not receiving compensation for it (other than from Seeking Alpha). The author has no business relationship with any company whose stock is mentioned in this article.

The Weakness In The Natural Gas Market Persists

Summary The price of UNG kept coming down last week. The low extraction from storage is related to the warmer-than-normal weather. The recent rally in oil didn’t bring UNG back up. The recent recovery in the oil market didn’t provide any back-wind for The United States Natural Gas ETF, LP (NYSEARCA: UNG ) that kept coming down in the past week. The Energy Information Administration reported another lower-than-anticipated withdrawal from storage. (Data Source: EIA, Google Finance) The chart above presents the normalized prices of natural gas and UNG since the end of November 2014 till date – over this time frame, UNG fell by 38% and natural gas by almost 37%. This modest gap is due to roll decay attributed to the contango in futures markets. For now, the markets are still in contango, which means this gap between UNG and natural gas prices is likely to further widen in the coming months. But this also suggests that the market expects natural gas prices to start picking up again in the coming months. The EIA reported another lower-than-expected extraction from storage of 115 Bcf. In comparison, the extraction last year was 270 Bcf and the 5-year average was 165 Bcf (as a side note: these comparisons are only intended to provide crude base lines – after all, they also entail a lot of noise (as is the case in any weekly comparison), and as such, we should put an asterisk next to these base lines). The ongoing lower-than-expected extraction from storage may have rendered another blow to UNG this week. Most of the shifts in storage this time of the year are related to changes in weather. The relation between the changes in storage compared to the 5-year average and the shifts in temperatures from normal has remained strong this winter – the linear correlation is still at 0.74, which means the R-square is around 54% (this result in based on certain assumptions, including linearity and normality – two assumptions that might not hold up under scrutiny). This result only tends to show that the ongoing warmer-than-normal winter, on a national level, has kept the extraction from storage lower than normal for this extraction season. On top of this, the current storage level is around 24% higher than only 1.2% below the 5-year average. So the lower extraction, along with relatively normal storage levels has been enough to bring down the price of UNG to its current low levels. (Data Source: EIA , National Climate Data Center ) Last week’s deviation from normal temperatures was 6.38. So for next week’s storage report, the extraction from storage is likely to be, yet again, lower than the 5-year average, which was 165 Bcf. The ongoing low withdrawal is likely to bring storage to even slightly higher-than-normal levels in the coming weeks. Over the next couple of weeks, the weather is still projected to be colder than normal in the east and hotter than normal in the west. For February, the recent monthly report of the National Oceanic and Atmospheric Administration predicts above-normal temperatures in many parts of the U.S., except for certain regions such as the Northeast. But the weather forecast still entails uncertainty mainly related to a potential El Nino. But for now, it seems hard to see how UNG will start to pick up again to its high levels unless the weather starts to get much colder than it is now. After all, even the recent recovery in oil prices didn’t bring natural gas up. The recent news from Baker Hughes of the sharp drop in oil rigs has influenced oil inventors to adjust (or speculate on) their expectations about changes to the U.S. oil supply. This news brought oil prices back up in the past week. Oil rigs have declined by 83 rigs last week, and by a total of 276 rigs in the past year. But this rally didn’t seem to have much of an impact on natural gas prices, which only kept coming down. After all, gas rigs slipped by only 5 in the past week to reach 314. The uncertainty in the weather forecast for February could imply high volatility in the natural gas market. If the withdrawal from storage continues to be lower than normal, this could keep the price of UNG down. For more see: ” Has the Weakness in Oil Fueled the Decline of UNG? ” Disclosure: The author has no positions in any stocks mentioned, and no plans to initiate any positions within the next 72 hours. (More…) The author wrote this article themselves, and it expresses their own opinions. The author is not receiving compensation for it (other than from Seeking Alpha). The author has no business relationship with any company whose stock is mentioned in this article.

Sell Your Employer, Get VTI Instead

Summary Many employees hold stock in the company that employs them. Taking advantage of plans that offer a discount on stock makes sense, but don’t let it overwhelm your portfolio. By not rebalancing frequently enough, employees may find themselves with diversifiable risk. The excess risk provides no excess (expected) return, and the risk isn’t just having too much of one company in your portfolio. I’m suggesting investors take a better look at replacing their employer’s stock with VTI whenever the option is available. The last week I’ve been doing a great deal of research on behavioral finance. There are several potential pitfalls for investors to avoid, but most investors are not familiar with behavior finance. I’ll be highlighting several of those pitfalls so readers can watch out for them. My focus in this article is why the Vanguard Total Stock Market ETF (NYSEARCA: VTI ) is a better investment than your employer. I can’t say that VTI will provide better returns, but I am confident that the expected return for the level of risk will be superior. Two problems with owning your employer: Problem #1 The first problem should be fairly clear to most investors. Holding individual companies is a fine way to invest, but it creates a substantial amount of diversifiable risk if individual companies are a large part of the portfolio or if multiple companies within the same industry are being selected. When the position in the employer reaches higher levels, say 10 or 15%, it becomes a substantial risk factor for the portfolio. Two problems with owning your employer: Problem #2 The second problem is one that many intelligent people manage to completely overlook. The second risk factor is that you are exposing the value of your portfolio to the same risk factors that are impacting the value of your lifetime earnings. Let’s start with an extreme example: Enron Long-term employees had ample opportunity to build up substantial positions in the company stock. When a company goes out of business, the employees are facing unemployment. If they also held the stock, they risk seeing the value of their portfolio decline substantially. If the firm employs a substantial number of people with their skill set within the geographic area, several former employees may be faced with needing to move in order to find new work. The concentration of that skill set exceeding the number of available positions makes it an unfortunate situation that is even more significant for employees that own their home and will be facing transaction costs on selling the house. Industry risk On top of the company-specific risk, there is also a level of industry risk. If the company is closing locations because the industry is less profitable, finding a job with a competitor will be more difficult. It would be preferable for the employee to have less than normal exposure to his industry within his portfolio. Whether the firm is in biotech or car manufacturing, the price that the employee’s skill set can command in the free market is still dependent upon supply and demand within the industry. Solving the problem There are two ways to solve this problem. An investor can either attempt to build a diversified portfolio that intentionally has less than normal allocation to their industry. However, I think it is much simpler and more cost efficient, due to trading commissions, to simply buy the Vanguard Total Stock Market ETF. I’ve heard people lately talking about how the stock market is being valued too highly. I think some of those analysts raise very legitimate concerns. However, I also believe that market timing has a negative expected value. Attempting to find the right time to jump in may be viable for individual companies, but trying to find the right time for buying the entire market is another challenge entirely. When was the right time to buy? In my opinion, several decades ago would have been great. Since that isn’t an option, I favor investing in the total market at the present time. Is this the perfect moment? I doubt the timing is perfect. Whichever day you buy into the market, there may well be a day in the future that offers a lower price. Buying into the market and having the value never dip under the entry price has more to do with being lucky than good. How I’m doing it Over the next couple months, I’ll be overhauling my positions. The vast majority of my positions are in tax advantaged accounts, so I’m not concerned about the ramifications of capital gains. I’ll do the rebalancing as soon as I finish with filing taxes for 2014. I need to know how I’m going to split up my contributions to Traditional and Roth IRA accounts. I don’t know if the market will move up or down during that time, but I expect VTI to be trading right about NAV due to the enormous trading volume. For investors not familiar with VTI, the average is over 3 million shares per day. I’ll buy at whatever the price happens to be at the time, and I’ll be investing over half of my total investment portfolio. Why VTI? When I started looking at ETFs for my portfolio, I started looking at SPDR S&P 500 Trust ETF (NYSEARCA: SPY ). I started running historical numbers comparing the volatility of portfolios that included ETFs with exposure to several investing factors. I included emerging markets, precious metals, bonds, and bonds in other currencies. What I found was that it was possible (historically) for an investor to find better returns and lower risk through a global portfolio. However, the returns did not take into account any trading costs and the difference was not very substantial. After seeing how well SPY was able to do against the much more complicated portfolios, I decided it would be better to try to replicate it. VTI offers extremely high correlation to SPY, which isn’t surprising given how many of the same equities are being held. However, VTI is offering exposure to smaller cap companies without having such a large position that it would substantially alter the returns. The result is an ETF that offers extremely similar performance to SPY with a slightly lower expense ratio. For VTI it is .05%, for SPY it is .09%. Conclusion If an investor is holding stock in their employer, it would be prudent to consider swapping the position for VTI or SPY. If the position is required as part of a program that allows employees to buy the company stock at a discount to the market price, it may be reasonable to retain the amount of stock required by the program. For any excess cash being invested, VTI or SPY offers dramatically lower risk for the investor’s life. The risk is not simply the standard deviation of the portfolio value. Investors need to be aware that holding their employer exposes their portfolio to precisely the same risks that their career is facing. That is a risk that all investors should seek to diversify. Disclosure: The author has no positions in any stocks mentioned, and no plans to initiate any positions within the next 72 hours. (More…) The author wrote this article themselves, and it expresses their own opinions. The author is not receiving compensation for it (other than from Seeking Alpha). The author has no business relationship with any company whose stock is mentioned in this article. Additional disclosure: Information in this article represents the opinion of the analyst. All statements are represented as opinions, rather than facts, and should not be construed as advice to buy or sell a security. Ratings of “outperform” and “underperform” reflect the analyst’s estimation of a divergence between the market value for a security and the price that would be appropriate given the potential for risks and returns relative to other securities. The analyst does not know your particular objectives for returns or constraints upon investing. All investors are encouraged to do their own research before making any investment decision. Information is regularly obtained from Yahoo Finance, Google Finance, and SEC Database. If Yahoo, Google, or the SEC database contained faulty or old information it could be incorporated into my analysis. The analyst holds a diversified portfolio including mutual funds or index funds which may include a small long exposure to the stock.