Tag Archives: nysephk

PIMCO High Income Fund: Is The Pain Over?

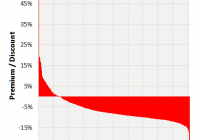
Summary PHK’s premium has fallen from over 50% to around 30%. That’s a big drop and well below the CEF’s 3-year average premium. So is the pain over and now the time to buy back in? The PIMCO High Income Fund (NYSE: PHK ) is a contentious closed-end fund, or CEF, that has a long history of trading at an impressive premium to its net asset value, or NAV. Right up front, I’m not a big fan of any CEF trading above its NAV, particularly at such an extreme premium. However, after such a large drop, some investors may be wondering if the hurt is over and whether now might be a good time to buy in. A little background To understand why a closed-end fund trades at a price different than its net asset value, you have to understand how CEFs differ from their mutual fund cousins. Mutual fund sponsors stand ready to buy and sell shares at the close of every trading day at NAV. Therefore, there’s a premade liquid market at NAV. Closed-end funds, meanwhile, sell a set number of shares to the public. Those shares then trade based on supply and demand on the open market. If investors like a CEF for whatever reason, they will demand a higher price to get them to sell. And if investors don’t like a CEF for some reason, they will take lower prices to get out. Thus, CEFs trade above and below their NAV. The NAV is still what the shares are worth – it is their intrinsic value, if you will. But it isn’t always what they will trade for. Using a simple example, if investors are fond of biotechnology a biotech-focused CEF might find itself trading at a 10% premium to NAV. The reason is investor sentiment; essentially investors are saying they expect good things from the CEF in the future. The important take away is that investor sentiment is the driving factor – not the actual value of the CEF’s shares. People really like PHK Closed-end funds normally trade around their NAV or at a discount. It’s unusual to see a CEF with a long history of trading well above NAV. PHK, then, is an exception to the norm. It’s long traded at a premium, and notably, at an extreme premium to its NAV. For example, its three-year average premium is nearly 50%. Its five-year average is just over 50%. People really like PHK. I’ve posited that the reason for this premium was partially because Bill Gross took over managing the fund in 2009, the year in which the premium started to widen. Since he’s no longer there, others have noted the fund’s steady distribution even through a difficult market period – notably the 2007 to 2009 recession. In the end, it’s probably a combination of the two. But whatever the reason, the CEF has a long history of trading well above its NAV. Which is why some argue that the selloff from an over 50% premium to the more recent 30% premium is a buying opportunity. This is a normal investment approach in the closed-end fund space, buying when a CEF is notably below its average premium/discount. The idea being that investor sentiment likely went too far in one direction and will eventually swing back toward the historical level. On the one hand, this makes sense for PHK. The average premium is close to 50% in recent history, so at a 30% premium, it’s fallen pretty far from the norm. In fact, this isn’t the first time there’s been such a drop. In the back half of 2012, PHK went from a roughly 75% premium down to a 25% premium before recovering to a 40% premium and eventually to the 50% and 60% levels seen earlier this year. I’d say, for aggressive investors who like to trade premiums and discounts, this is a CEF you should be looking at. Still too expensive But if you are a conservative investor, you should still avoid PHK. Why? We know with almost no doubt what PHK is worth; that’s the point of net asset value. That’s the value of PHK, no more and no less. If you buy PHK for a 30% premium, you are paying 30% more than its portfolio is worth on a per share basis. One of the reasons why playing premiums and discounts works is because you know the value of the asset you are buying – its NAV. So when a CEF is trading well below its NAV, there’s a clear catalyst for the discount to narrow. As investors realize the disconnect between price and value, they’ll correct it. PHK, however, is trading below its historical premium . Which means that anyone buying now is betting that investor sentiment will improve so that the premium gets wider. That’s akin to momentum investing in which you buy an expensive stock hoping that you can eventually sell it to someone at an even more expensive price – with little regard to its intrinsic value. There’s nothing wrong with this when it works, and it does work for some people. But it can also go horribly wrong when investors have changed their minds. Think back to the carnage in the dotcom bust, when investors realized that they didn’t like Internet companies as much as they thought they did. The companies didn’t change, investor psychology did. So, if you are a conservative investor, why bother buying something you know is overpriced? There are so many investment options in the market that taking such risks just isn’t worth it. And that’s true even taking into consideration PHK’s 15% yield. I’d rather take a yield half that and sleep well knowing that I don’t have to rely on fickle investors to buy my shares at a higher price. Or, better, yet, I’d rather buy something trading below its NAV and below its average discount, and wait for the market to realize the price disparity. With the NAV being a magnet to draw investors in to an undervalued investment opportunity. So, if you are an aggressive CEF investor looking to play discounts and premiums, PHK is definitely worth a look. Just go in knowing the game you are playing. I’d still suggest caution, but the fall from the average at PHK fits the bill for the trade. For conservative investors, don’t get sucked in by a big yield or the fall in the premium. PHK is still expensive even after its premium has fallen some 20 percentage points, and the yield just isn’t worth paying a still high 30% premium. You’ll be better off investing elsewhere. Disclosure: I/we have no positions in any stocks mentioned, and no plans to initiate any positions within the next 72 hours. (More…) I wrote this article myself, and it expresses my own opinions. I am not receiving compensation for it (other than from Seeking Alpha). I have no business relationship with any company whose stock is mentioned in this article.

Exploiting Market Inefficiency In Closed-End Funds

Summary Closed-end funds are widely considered to be the most inefficient of tradable securities. A recent paper examining closed-end fund discount and premium status conclusively demonstrates that mean reversion is a feature of the funds and can be the basis of a trading strategy. Mean reversion rates vary among asset classes. Fixed-income fund revert faster than equity funds. Exploiting Market Inefficiency In Closed-End Funds One of the clichés bandied about regarding closed-end funds is that they are the least efficient of investment vehicles. This should be obvious from the fact that the vast majority sell at discounts to their net asset values. By any reasonable interpretation of an efficient market, CEFs should always be selling at or near their NAVs. But such is certainly not the case. A quick look at the universe of 567 funds listed on cefconnect.com shows that 86.4% of them sell at a discount, with the median discount at -8.33%. To illustrate the point, I worked up this chart, showing the P/D distribution for all 567 funds. It illustrates just how contrary to an assumption of market efficiency the closed-end fund universe is. Premiums range from PIMCO Global Stocks Plus (NYSE: PGP ) and PIMCO High Income Fund (NYSE: PHK ) two fixed-income PIMCO funds at the high end of the scale with premiums over 60%, to lows under -30% for two tiny US equity funds, RENN Global Entrepreneurs Fund (NYSEMKT: RCG ) and Foxby Fund (OTCQB: FXBY ) at the bottom. If we take a 1% deviation from NAV as a generous expectation of reasonably efficient pricing, we find that only 5.1% of funds would even meet that loose standard. So, it seems clear that the closed-end fund market is inefficient. But it appears that it’s even more inefficient than this standard might indicate. To demonstrate I want to discuss a paper by Dilip Patro, Louis R. Piccotti and Yangru Wu titled Exploiting Closed-End Fund Discounts: The Market May Be Much More Inefficient Than You Thought . The paper, which is a bit more than a year old, only recently came to my attention. I like it because it validates an approach I’ve been using in my own investing in closed-end funds. An approach I’ve discussed and some commenters have considered to be unjustified. The authors looked at all closed-end funds. They contrasted trading strategies taken from the existing literature that bought funds with the greatest discounts and sold funds with the greatest premiums to a strategy based on an assumption of mean reversion by funds to premium/discount equilibrium levels. They began by formally testing for mean reversion of premiums and discounts for each individual fund, and showed that the majority do exhibit significant mean reversion. Results indicate a mean rate of reversion of 8.6% a month, which implies an average half-life of 7.7 months. Further, they showed significant differences among asset classes. Fixed-income funds have faster rates of mean reversion (10.4% a month) than equity funds (7.5%), and within the equity category, international funds reverted faster than domestic funds. Once they had established the significance of mean reversion in premium/discount they turned to a model arbitrage strategy based on this fact. The strategy consisted of buying the quintile of closed-end funds with the highest estimated returns and selling the quintile of closed-end funds with the lowest estimated returns. Their strategy greatly outperformed one from previous studies involving buying the most deeply discounted funds and selling those with the highest premiums. This table summarizes the results. (click to enlarge) The earlier strategy, buying funds with the lowest discounts and selling those with the highest premiums, generated an annualized mean return of 14.9 percent with a Sharpe ratio of 1.52. The mean-reversion based strategy produced an annualized mean return of 18.2 percent and a Sharpe ratio of 1.92. The chart below shows monthly results. (click to enlarge) They went on to look at commonly used risk factors and concluded that the results could not be explained by the three Fama and French factors, the Carhart momentum factor or the Pástor and Stambaugh tradable liquidity factor. Much of the math used in this study is beyond all but the most sophisticated investor (if you’re inclined to economic statistics, do check out the original paper) and not really useful for routine decision making. Nor is the strategy intended to be applicable as a practical, real-world investing scheme. Typical of academic research, it was designed to isolate and demonstrate the power of using mean reversion as a metric. Most important to a real-world investor is how an awareness of the highlights can inform decisions. Those highlights conclusively demonstrate mean reversion in discount/premium status for closed-end funds. Further they demonstrate that an investing strategy based on the expectation of mean reversion in discount/premium status outperforms strategies based on discount/premium status alone. And finally, they demonstrate that the outperformance of the mean reversion strategy is independent of five factors that might otherwise explain the enhanced return. For an investor the message is clear. First, closed-end funds are in fact the inefficient market vehicle many of us assume them to be. Second, discount/premium status, the manifestation of that inefficiency, does not, in itself, generate the greatest opportunity for exploiting that inefficiency. Third, reversion of discount/premium status to a mean value is a clear reality for closed-end funds. And finally, the market’s mispricing of closed-end funds relative to their NAVs coupled with the tendency to revert to a mean value provides exploitable opportunities. The study validates selection of closed-end funds with an eye to discounts over premiums, and historically exceptional discounts over simply using discount alone. It further validates selection of funds with exceptional deviations below their historical premium/discount status with the expectation of taking profits from the decay of the exceptional deviation. Although this was the only variable investigated by the authors, it is clearly not the sole variable one should use as a basis for choosing among CEF investments. One might, for example devise a strategy that superimposes discount mean-reversion on other factors. However one approaches closed-end fund investing, these results emphasize that it would be wise to incorporate this factor into one’s decisions. Finally, the variation noted among asset classes suggests caution in applying this element too broadly. It would seem to be most applicable to fixed-income funds and less so to domestic equity funds. For the entire study, risk-adjusted return (alpha) from the subsample of foreign funds was greater than that from domestic funds. Alpha from fixed-income funds was greater than that from equities funds. I think it’s fair to suggest that many close observers of closed-end funds have developed an intuitive sense that this is the case. They will be pleased to see their intuitions, gleaned from market observation, are validated by this careful statistical study. Editor’s Note: This article covers one or more stocks trading at less than $1 per share and/or with less than a $100 million market cap. Please be aware of the risks associated with these stocks. Disclosure: The author has no positions in any stocks mentioned, and no plans to initiate any positions within the next 72 hours. (More…) The author wrote this article themselves, and it expresses their own opinions. The author is not receiving compensation for it (other than from Seeking Alpha). The author has no business relationship with any company whose stock is mentioned in this article.