NextEra Energy’s Valuation Still Too Rich, Catalysts For Long-Term Growth Strong
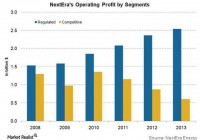
Summary Our pricing has moved up, but we are still looking at a $96 price tag. NextEra’s strong quarter in the latest earnings show great strength in renewable energy but comps were weak. Hawaiian Electric deal is moving along well, but it will still take another 9-12 months to finalize. Today, we are going to take a refreshed look at NextEra Energy (NYSE: NEE ). We first looked at the company in late February. At that time, we thought the company was fairly priced with potentially some room for a pullback. The reason was that we believed that the market was slightly overvaluing the utility space, and a correction was due. Since that report, the stock has dropped over 5% to the upper-90s. We noted we would be interested at the 90-level. Our main thesis was that, while the company’s health and catalysts were strong, valuations were pricing in a best-case scenario of 6% revenue growth and 22% operating margins consistently moving forward. We worried that was too aggressive perhaps, and even if not, an even better scenario would be needed to see upside. Today, we want to revisit our catalysts in the wake of the last set of earnings as well as other developments that have occurred. Additionally, we will take another look at our pricing model to update that given this analysis. 2015 Catalysts Revisited Economic Moat Strength What we saw as really the overall #1 strength of NEE was its dominant economic moat that it was able to have due its non-competitive arrangements with municipalities. What that means is that the company negotiates a “fair price” for a certain area if the municipality agrees to limit competition. Most areas of the country have similar agreements, and it helps to establish infrastructure and investment from utilities, while guaranteeing power, service, and price to end customers. As we noted before, NEE is very attractive because about 80% of its business is in the regulated arena, where profitability is strongest. This image from Market Realist tells the tale: (click to enlarge) The company maintains one of the highest margins in the industry with this strong mix, and there is little threat to a major push down. As long as the company can maintain this strong mix, it will be attractive for income, long-term investors. The real benefit or issue that could move the needle, though, was the company’s work in Hawaii… Hawaii – Another Regulated Market to Add Shareholder Value In 2014, NEE bought Hawaiian Electric (NYSE: HE ) for north of $4B. The move was a chance to come into a new market that was in need of cost savings and be able to combine a regulated market with the company’s practice of making efficient utility deliveries. Additionally, the company will bring its penchant for renewable energy to help build a better “mousetrap” in the state. The company had plans to revolutionize the space with solar energy. The state is one of the best for solar energy. So, how have things been moving since the last time we looked at the company. There have been quite a few developments. Right now, the main aspect of the deal is just to get it done and approved. In April, HE’s CEO came out saying he was confident that the deal would be completed within a year, and the Hawaiian House of Representatives put a resolution in place to complete the deal by June 2016. Given the market is regulated, it is a major decision for Hawaii, consumers, etc. In the latest earnings transcripts , when CEO James Robo was asked about approval, he stressed that he still believes it will be done by the end of the year: Steven Isaac Fleishman – Wolfe Research LLC Yeah. Hi, everyone. Just further on the Hawaiian deal, what’s the latest in terms of timelines for approval? James L. Robo – Chairman, President & Chief Executive Officer Steve, we’re still hopeful that we’re going to be able to get all regulatory approvals by the end of the year and that’s the target that we’re working towards. Steven Isaac Fleishman – Wolfe Research LLC Okay. Is there any movement toward like settlement discussions or still more formal process? James L. Robo – Chairman, President & Chief Executive Officer I think, Steve, that we’re very early in the process right now and discovery will be ongoing through the summer. And we expect all of the filings to be done by the end of August and so, anything on the settlement front would be very premature. Moray P. Dewhurst – Vice Chairman & Chief Financial Officer Steve, just data; we filed formal testimony. I think we’ve had some 300 interrogatories or data requests so far. We can expect to have a lot more over the coming months. That’s good. We want to make sure that all legitimate questions are appropriately aired and that people get the answers to the questions they have because we firmly believe this is fundamentally a good deal for folks in Hawaii, customers, as well as for shareholders. So we want to make sure that all the facts come out, but it will take a while and the schedule calls for that to go through the summer. It looks like this summer will be key to briefing the necessary parties, filing all the necessary paperwork, and completing the process. Overall, the process is moving along like most deals with some hiccups but generally fine. One item that did come up was that HE had to extend the shareholder vote to get the majority they needed for the acquisition, which does not necessarily mean that it wasn’t liked by shareholders. Overall, though, we believe this deal is very important to NextEra Energy. As we noted previously: The company brings the expertise of how to apply a mix of renewable energy and create consistent returns. With the prices that Hawaii is used to paying, the company should reduce costs for Hawaiians yet also make a strong profit. The company’s mix, though, of more green energy plays has not been as profitable. The company still makes its bread and butter in Florida where it uses a majority natural gas. So, the question will be if they can return the type of 20% operating margin in Hawaii? The nice thing that is baked into the cake for them is that Hawaiians are used to paying more than most Americans, so they will be able to invest more easily. We will continue to monitor this situation, but for now, the company looks like they are still on track. Current Pricing The latest earnings for NEE were pretty solid in the latest quarter. EPS came in at 1.41 versus 1.28 expectations as well as a beat for revenue as well. The company’s results were helped by an improving Florida economy that led to more additions as well as a lot of strength in NextEra Energy Resources, which saw a 41% increase in revenue. The NEER division is the renewable contracted part of the business, and that type of growth shows just how in demand renewable energy is becoming. In this section, we will want to take a look at our last pricing analysis, update it, and determine what we believe is a fair value price for NEE. In order to price the company, we need to make certain assumptions. In our last article, we modeled revenue growth will continue at a clip of 4-5% per year, and we believe that level will maintain for the next several years. The gains in NEER are not sustainable, and a lot of the gains were going up against the very adverse weather conditions one year prior. Most analysts are only modeling for 1% growth still for this year, but we are using an annualized figure. Utility revenue is fairly consistent. The key to the company is definitely margins. Operating margins are key to our DCF analysis. The coming has forecast that they will come in at the 22-23% in 2015, but I imagine this number will dip some with the onslaught of Hawaiian Electric when it is approved. In Q1, the company’s operating margins were strong at 28%. Again, the 42% operating cash flow return at NEER buoyed this higher, and the company stated they see a 20-25% overall operating cash flow return in that division for the full year. For 2015, we believe 22-23% is a bit light, and we will increase our expectation to 25%. As for the HE deal, it should add roughly $4.5B in sales in 2016, but the company operates with a 10% operating margin. The deal is really essentially to take what is a tough market for making money, revolutionize it, and improve it. This plan, though, will take several years. Therefore, margins will drop in 2016 but gradually improve again through 2020. Taxes have averaged roughly 25% for the past five years, and it’s likely this will stay around 28%-30% over the next several years. We may see it jump even a bit more beyond 2016 when more solar credits are expected to expire. Depreciation will continue to grow at about the same rate as revenue growth. Capex should come down in 2015 to around $6B and again in 2016 to $4B.The $4B rate, though, is pretty standard for the company. Our WACC rate is 5% for discounting. When we use this math in our five-year DCF analysis, we were looking at a low-90s number. We have made some positive adjustments, and here is our projections: PROJECTIONS 1 2 3 4 5 2015 2016 2017 2018 2019 Income from Operations 4350 3654 3990 4347.2 4726.73 Income Taxes 1218 1023.1 1117.2 1217.2 1323.48 Net Op. Profit After Taxes 3132 2630.9 2872.8 3130 3403.25 Plus: Depreciation 2600 2700 2800 2900 3000 Less: Capex -3600 -3900 -4000 -4100 -4200 Less: Increase in W/C -100 -100 -100 -100 -100 Available Cash Flow 2,232 1,531 1,773 2,030 2,303 When we complete the math here, we are now looking at a $96 price tag. The key areas to contemplate are how much will margins drop when HE comes online and how much growth will it bring about. Further, will CapEx be drastically higher in 2016 as the company invests into the infrastructure? These questions are tough to model, but this model appears to be friendly and mid-to-best-case. Thus, we are still coming in around where NEE is performing today. Conclusion NextEra has interesting catalysts to 2015, but after a tremendous run in 2014, the company looks like its upside may be limited in the near-term. The recent pullback is a sign that the stock has gotten ahead of itself, and valuations are still rich. Right now, we like the stock as a long-term play in safety, but it will only be an income play with limited value upside. Yet, for its socially responsible model, the company presents another interesting dynamic. Disclosure: The author has no positions in any stocks mentioned, and no plans to initiate any positions within the next 72 hours. (More…) The author wrote this article themselves, and it expresses their own opinions. The author is not receiving compensation for it (other than from Seeking Alpha). The author has no business relationship with any company whose stock is mentioned in this article.