Irish Midyear Review
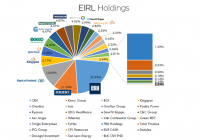
Summary Ireland is predicted to have the highest GDP growth among EU countries in 2015. EIRL has gained over 13% during first two quarters of 2015. Irish economy is quickly recovering due to good economic policy and a favorable macroeconomic climate. Concern over Greece may dampen growth in H2 2015 while the domestic real estate boom remains a longer-term worry. EIRL is poised to be a solid long-term investment for those seeking exposure to Eurozone’s fastest growing economy. ETF Overview The iShares MSCI Ireland Capped ETF (NYSEARCA: EIRL ) is a passive ETF which provides exposure to the Irish equity market. It seeks to track the MSCI All Ireland Capped Index. It’s a relatively costly ETF with a 0.48% expense ratio (although this relativity depends on whether you are used to investing in mainstream inexpensive ETFs or more costlier exotic ones). It also trades at a 0.86% premium to its NAV as of 2nd July. Nonetheless, if you are looking for sole exposure to the Irish equity market, EIRL is the only choice available today. EIRL is comprised of 25 constituents with several holdings representing a sizeable portion of the fund. The breakdown of holdings since adjustment in July 2015 is as follows: (click to enlarge) (Source: Own graph based on iShares data) The largest holding is CRH plc (NYSE: CRH ) – the parent company of an international building materials group. The second largest holding is the food and beverage corporation Kerry Group ( OTCPK:KRYAF ), taking 11.76% of the slice. The third largest holding is the national Bank of Ireland ( OTCPK:IRLBF ) with a 10.85% share. Overall, the top ten holdings represent almost ¾ of the overall fund and marked changes in the share price of the top three companies in particular can sway the ETF significantly. As result of this top-heavy composition, the ETF is heavily exposed to materials and consumer staples. Consequently, the performance of the ETF depends also on the general movement in these sectors. (Source: iShares) From 1st January until 1st July, EIRL has appreciated 13.03%. EIRL’s growth during these six months dwarfed that of SPDR S&P 500 Trust ETF (NYSEARCA: SPY ) which gained one percent over the same period. It also vastly outperformed the Vanguard FTSE Europe ETF (NYSEARCA: VGK ), one of the most liquid and inexpensive passive full-replication ETFs providing exposure to major European markets (including Ireland). EIRL data by YCharts The key metrics of EIRL as compared to SPY and VGK are summarized in the table below: ETF Comparison EIRL SPY VGK Issuer iShares SSGA (SPDR) Vanguard Expense Ratio 0.48% 0.09% 0.12% Shares 2.7m 819.19m 264m 3m avg vol. 33,327 102.64m 4.64m P/E Ratio 21.50 19.09 20.70 Equity Beta 1.25 1.00 1.09 Div. Yield 1.33 1.87 3.28 (Source: ETFdb , Yahoo! Finance ) Macroeconomics Far from being one of the original PIIGS, Ireland has performed an incredible turnaround in its economic fortunes following its bailout by the Troika. A period of austerity has allowed the country to decrease its budget deficit to within 3% of GDP and report a 4.8% GDP growth in 2014, the highest in Europe. Similarly, Ireland is predicted to grow the fastest in the EU this year with an estimated 3.8% GDP growth. Earlier this year, the Irish Central Bank expressed a very auspicious view about the state of Irish recovery in one of its quarterly bulletins: The momentum of recovery in the Irish economy continues to build and broaden, with domestic demand now making a significant positive contribution to growth. While the strength of net export growth was an important driver of the preliminary estimate of 4.8 per cent GDP growth last year, the recovery in the economy has become more balanced over the past year. Domestically, the continued strong increase in investment spending has been supported by the beginning of a recovery in consumer spending, which is showing signs of gradually strengthening. The pick-up in consumption has benefited from continuing favorable labor market developments, in particular growth in employment, which is helping to boost incomes. With consumer and investment spending both growing, domestic demand added to growth last year for the first time since 2007. (Source: Central Bank Quarterly Bulletin Q2 ) The unashamedly enthusiastic tone of the Central Bank can be forgiven given the years of hardship and turmoil, but it is worth pointing out one important detail about the reported 4.8% GDP growth in 2014. As one of the leading Irish economy commentators Constantin Gurdgiev in another SA article pointed out, up to 43% of Irish growth in 2014 can be attributed to the ongoing shift by the MNCs from profit-booking to cost-based transfer pricing, otherwise known as “contract manufacturing.” In essence, low-margin activities are outsourced abroad by MNCs and the resulting revenues are booked into Ireland. This will also skew any 2015 growth figures, so in effect some of the miraculous Irish GDP growth may well be illusory. Despite all this, exports did grow by 12.6% in 2014. In part, this was due to stronger demand from the U.K. and the U.S. (thanks to a weaker Euro). Although, it would be a mistake to attribute export growth entirely to a more favorable foreign exchange rate. This chart from the Q2 Bulletin based on CSO (Irish statistical agency) figures shows the extent of the rebound in the volume of industrial production in 2014. This growth was helped by strong growth in construction, pharmaceuticals and in the traditional Irish-owned sector which includes food and beverages. (Source: Central Bank Quarterly Bulletin Q2) In light of this, it’s important to remind that the top 5 constituents of EIRL include two construction materials companies (CRH and Kingspan ( OTC:KGSPY )) and two food and beverage companies (Kerry Group and Glanbia ( OTCPK:GLAPY )). Speaking of construction, one of the biggest drivers of Irish economy in 2014 was the staggering rise in property prices , topping Knight Frank’s global house price index with a 16% leap. Once again, the official graphs from the Central Bank show the all too familiar trend from the days of the Celtic Tiger. (click to enlarge) (Source: Central Bank Quarterly Bulletin Q2 ) Building and construction investment grew by about 9% in 2014, and while the surge in construction and real estate prices is certainly a boon to companies in the materials sector in particular. To everyone else, it’s yet another cost of living eating away at Ireland’s competitiveness in Europe, which Ireland tries to make up for with its near tax haven status. The plan seems to be working because earlier this year the unemployment rate dipped below the 10% line – a noticeable improvement over the 14.5% rate that pervaded in Ireland for quite some time. Interestingly, Ireland is still only middle of the pack among its EU peers in relation to youth unemployment (15-24 year olds) which stands just above 20%. (click to enlarge) (Source: The Economist ) The markets seem convinced with the Irish economy. Two months ago, the National Treasury Management Agency (an agency which borrows on behalf of the Irish government) sold 10-year bonds at a yield of 0.64%. As a backdrop, in the thick of the financial crisis in 2011, Irish 10-year bond yields reached 14%. In early June, S&P revised the Irish credit rating by one level to A+ from A with a stable outlook, citing “Ireland’s improved fiscal performance, higher state asset sales, and robust economic performance”. European QE will also have had a significant effect on both equity performance and investor confidence in 2015. Recently, the bond yields have risen to roughly around 1.70% on fears over Grexit. The Greek question is indeed central to the performance of the Irish and European economies in the near future. However, the Irish government officials maintain that the fallout from a possible Grexit on the Irish economy will be minimal and that there would be few contagion effects. Although the ECB may have spent four years insulating the Eurozone from contagion effects, it is in fact investor expectation that drives the markets, so there is definite risk of some uncertainty if Greece does exit the euro. Given that the Greeks voted No in the referendum, this possibility increases significantly. Major Holdings’ Performance EIRL’s major holdings had a great half year on the back of European QE and improving Irish economy. Construction materials companies had a particularly good run, with Kingspan gaining over 55% during the first six months of 2015. (Source: Own graph/research) CRH plc. CRH stock grew by 28.14% over the half year, continuing its run since late 2014 when the company announced an acquisition deal worth €6.6bn with Lafarge ( OTCPK:LFRGY ) and Holcim ( OTCPK:HCMLY ). The company reported “a satisfactory start” to 2015 in line with expectations, with continued momentum in Americas and sluggish growth in Europe. Over the second half of the year, the company expects Europe’s favorable monetary policy to “support organic improvement” across its main markets. Kerry Group Kerry Group gained over 14% in the year to date; however, the Group is faced with volatile food prices and a deflationary environment, which is expected to last into H2 2015. In Q1, the Group reported an increase in profit margin of 20bps despite challenges in developed markets and uncertainty in developing ones. The Group expects growth ahead of its markets with a good innovation pipeline and a well-positioned brand portfolio. Bank of Ireland BOI grew by around 14% to date. The bank still maintains tight cost controls and is focused on improving the quality of its assets. The bank recently delisted from NYSE and terminated its ADR facility. Otherwise, Bank of Ireland reports positive consumer sentiment, an increase in lending in line with expectations and a favourable economic environment. A weaker Euro increased the Group profits due to U.K. Sterling operations. The bank is regarded as “well capitalized” with a CET 1 ratio above 10%. Conclusion EIRL is the only ETF providing direct exposure to the equity market of a country which is predicted to be a growth champion in Europe in 2015. The outlook for Irish economy is certainly positive, if somewhat overstated. Ireland has adhered to its bailout program and learned a lot about banking regulation in the process. Therefore, the biggest foreseeable challenges are the continually deteriorating situation in Greece, where voters have voted “No” to a compromise with international creditors and the steep rise in real estate prices, which can take bubble-esque proportions. As Bertie Ahern, Ireland’s Taoiseach during the prosperous Celtic Tiger years quipped in 2006: “the boom is getting boomier.” Since the ETF is fairly illiquid, it makes sense as a more long-term investment and certainly the long-term fortunes of the Irish economy seem favorable, if a little burdened by public and sovereign debt. Editor’s Note: This article covers one or more stocks trading at less than $1 per share and/or with less than a $100 million market cap. Please be aware of the risks associated with these stocks. Disclosure: I/we have no positions in any stocks mentioned, and no plans to initiate any positions within the next 72 hours. (More…) I wrote this article myself, and it expresses my own opinions. I am not receiving compensation for it (other than from Seeking Alpha). I have no business relationship with any company whose stock is mentioned in this article.