Tag Archives: seeking-alpha

Prudential Launches Unconstrained Bond Fund

By DailyAlts Staff Unconstrained bond funds have a reputation for being risky and imprudent, at least in some corners. After all, the funds are unconstrained – it’s right there in the name. But with interest rates at historic lows and widely expected to begin rising soon, holding a long-only traditional fixed-income portfolio may be the truly imprudent strategy. In light of this, Prudential Investments – a well-established firm with “prudent” right in its name – launched an unconstrained bond fund of its own on July 9: The aptly titled Prudential Unconstrained Bond Fund (MUTF: PUCAX ) . Unconstrained Prudence? Can a fund be truly both “prudential” and unconstrained? Prudential’s new fund seeks positive returns over the long term, regardless of market conditions by investing across multiple fixed-income sectors. The fund’s debt holdings are diversified within the fund, which is a prudent approach to unconstrained investing, and its aim for low correlation to traditional investment strategies – such as long-only fixed income – allows it to bring diversification benefits to existing portfolios. There’s certainly nothing imprudent about that. Minimal Constraints Calling the fund “unconstrained” is a bit of a misnomer, too, since its investment strategies do have some (very minor) constraints: For one, no more than 50% of its assets can be invested in non-U.S. fixed-income investments. The fund is also limited to a maximum of 25% of its assets invested in derivatives. And, “under normal circumstances,” at least 80% of its assets will be invested in debt instruments of some kind – these may include bonds, notes, commercial paper, mortgage-related securities, asset-backed securities, municipal bonds, loan assignments, and money market instruments. Investment Approach The fund is unconstrained in the sense that it’s not judged against a benchmark – and it has a highly flexible strategy that seeks to manage the dollar-weighted average effective duration of its holdings to between -5 and 5 years. The ability to radically adjust its positions, use leverage, and ignore benchmarks allows the fund to pursue its “unconstrained” objective of long-term positive returns regardless of market conditions. The fund’s portfolio managers can shift exposures as opportunities present themselves. Management Prudential Investment Management, a wholly owned subsidiary of Prudential Investments, is the fund’s sub-advisor. Its portfolio managers include Michael J. Collins, Gregory Peters, Richard Piccirillo, and Robert Tipp, all of whom have experience managing other funds at Prudential. Fees and Minimums Shares of the Prudential Unconstrained Bond Fund are available in A (PUCAX), C (MUTF: PUCCX ), and Z (MUTF: PUCZX ) classes. The investment management fee is 0.80% for all share classes, while the A and C shares have respective net-expense ratios of 1.15% and 1.90%, and the Class Z shares have expenses of just 0.90%. The minimum initial investment for the A and C class shares is $2,500, while Z shares’ minimum is “generally none,” according to the fund’s prospectus. For more information, view the fund’s prospectus .

Global Macro: The Role Of A ‘Go Anywhere’ Strategy

By Andy Hyer Global macro is among the least restricted of all the major investment styles and is often referred to as a ‘go anywhere’ strategy which can potentially create positive investment returns in a wide range of economic environments. As shown in the diagram below, there is a rules-based process that we follow to manage our Global Macro portfolio (available on the Masters and DMA platforms at Wells Fargo Advisors and other SMA platforms , as a mutual fund – Arrow DWA Tactical Fund A (MUTF: DWTFX ) – and as an ETF – Arrow DWA Tactical ETF (NASDAQ: DWAT ). Investment Process We start with a broad investment universe of ETFs from the following asset classes: U.S. Equities, International Equities, Inverse Equities, Currencies, Commodities, Real Estate, and Fixed Income. That broad universe of ETFs is categorized into ETF Baskets, allowing us to rank the baskets by their relative strength. That top-down Basket Ranking part of the model seeks to guide the model to the strongest asset classes and to avoid the weakest asset classes. There is no forecasting in any part of this model-it is purely a trend-following strategy. There is also a bottom-up ranking of all of the ETFs in the investment universe. That ranking allows us to score each ETF to determine exactly what we buy and when a position is sold. 10 ETF are held in the Global Macro portfolio and the positions will stay in the portfolio as long as they retain strong relative strength. We’ve had some positions stay in the portfolio for years at a time and other positions that have been quickly removed. Any position stays in the portfolio only as long as it retains is favorable relative strength. (click to enlarge) Why Global Macro? Asset classes go through bull and bear markets. That goes for all asset classes. It is easy for someone to look at any 30 year period of time in history and use that period to suggest that all that is needed for any investor is a buy and hold approach to asset allocation using a narrow universe of asset classes. In one 30-year period, a 70% allocation to U.S. equities and a 30% allocation to U.S. fixed income would do the trick. However, take a different 30 year stretch and it may make more sense to include a healthy allocation to Real Estate or International Equities or Commodities. The ideal or optimal passive allocation for any 30 year stretch is only evident with the benefit of hindsight. Real investors have no idea what the future will hold. Rather than guess what asset mix might work best as they manage their retirement nest egg, a relative strength-driven Global Macro strategy relies on a strict trend-following approach to adapt to current markets. Investors may like to think that if they guess right and select the right passive asset allocation then their investment experience will be similar to the guy on the bike below (top of the image)…smoothly accumulating and compounding their retirement nest egg as they glide towards their retirement years. However, reality in the financial markets is anything but a smooth ride. Without an adaptive investment strategy as part of their asset allocation many investors will guess wrong and pick the wrong passive asset allocation. Furthermore, investor behavior being what it is, many investors will panic at the wrong times (and unwisely tinker with their asset allocations). Global Macro has the potential to play a soothing role for an investor and has the potential to help investors stay the course with their overall asset allocation. (click to enlarge) Source: @ThinkingIP Current Holdings As of 6/30/15, current holdings in our Global Macro portfolio were as follows: (click to enlarge) Performance We are very proud of the fact that Global Macro has performed well compared to its peer group over time. As shown below, The Arrow DWA Tactical Mutual Fund has outperformed 95% of its peers in the Morningstar Tactical Allocation category over the past 3 and 5 years; outperformed 92% over the past year, and has outperformed 68% of its peers YTD. Fact Sheet Click here for a fact sheet on our Global Macro portfolio. Nothing contained herein should be construed as an offer to sell or the solicitation of an offer to buy any security. This report does not attempt to examine all the facts and circumstances which may be relevant to any company, industry or security mentioned herein. We are not soliciting any action based on this document. It is for the general information of clients of Dorsey, Wright & Associates, LLC (“Dorsey, Wright & Associates”). This document does not constitute a personal recommendation or take into account the particular investment objectives, financial situations, or needs of individual clients. Before acting on any analysis, advice or recommendation in this document, clients should consider whether the security or strategy in question is suitable for their particular circumstances and, if necessary, seek professional advice. The relative strength strategy is NOT a guarantee. There may be times where all investments and strategies are unfavorable and depreciate in value. Relative Strength is a measure of price momentum based on historical price activity. Relative Strength is not predictive and there is no assurance that forecasts based on relative strength can be relied upon. Each investor should carefully consider the investment objectives, risks and expenses of any Exchange-Traded Fund (“ETF”) prior to investing. Before investing in an ETF investors should obtain and carefully read the relevant prospectus and documents the issuer has filed with the SEC. To obtain more complete information about the product the documents are publicly available for free via EDGAR on the SEC website ( http://www.sec.gov ).

ETFs For Your Core Domestic Stocks Portfolio: 3 Worthy Competitors

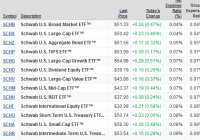
Summary Every ETF investor needs to consider what holdings will form the very core of their portfolio. For the portion relating to domestic stocks, in a previous article I featured Vanguard’s Total Stock Market ETF. In this article, I will examine two other worthy competitors, and analyze how they stack up against VTI. Every investor desirous of developing an ETF-based portfolio does well to start by selecting a few core holdings. In my view, such holdings should offer great diversification along with a rock-bottom cost structure. In a previous article for Seeking Alpha, I featured the Vanguard Total Stock Market ETF (NYSEARCA: VTI ). I concluded that one should seriously consider VTI as a core holding for the portion of your portfolio devoted to domestic stocks. However, there are several worthy competitors in the marketplace. And, they may be even more worthy if your brokerage offers commission-free trading in these ETFs; particularly if one of your goals is to invest regularly and in small increments. In this article, we will examine two such competitors; the Schwab U.S. Broad Market ETF (NYSEARCA: SCHB ) and the iShares Core S&P Total U.S. Stock Market ETF (NYSEARCA: ITOT ). We will compare their structure, expense ratio and other features against VTI, and see how they stack up. Schwab U.S. Broad Market ETF While the history of Charles Schwab (NYSE: SCHW ) traces back over 40 years, the firm is a fairly recent entrant to the ETF market, really getting into the area in a big way in 2009. However, once it committed, it quickly became a formidable competitor. The firm now sports no less than 13 ETFs featuring an expense ratio of .10% or less, as shown here: Heading the list is SCHB, with a market-leading .04% expense ratio. SCHB is based on the Dow Jones Broad Stock Market Index , which tracks the 2,500 largest publicly traded U.S. companies for which pricing information is readily available. This index is a subset of the Dow Jones U.S. Total Stock Market Index, but excludes companies defined as micro-caps. This index has a median market cap of $1.9 billion. Currently, there are exactly 2,506 stocks in this index. If you look at the informational table I include later in this article, you will note that SCHB only contains 2,020 stocks. The answer to why this is the case actually offers a helpful insight into how ETFs, particularly those with incredibly low expense ratios, are able to function. Here is the explanation given in the SCHB prospectus : Because it may not be possible or practicable to purchase all of the stocks in the index, the Adviser seeks to track the total return of the index by using statistical sampling techniques. These techniques involve investing in a limited number of index securities which, when taken together, are expected to perform similarly to the index as a whole. Look at that phrase “possible or practicable .” In other words, they are explaining that the trading costs involved in attempting to purchase every security in the index would lead to a greater tracking error (or divergence from the index) than their actual practice of sampling the index. In many ways, SCHB mirrors VTI quite closely. As of the date I researched this article, it has a 1.85% distribution yield, against 1.88% for VTI. The weighting of the Top 10 holdings in each fund is also virtually identical. The fund is significantly smaller than VTI, with “only” $5.0 billion in Assets Under Management (AUM) as compared to $55.6 billion for VTI. You will see a small reflection of this in average spread (see definition below) of .03% vs. VTI’s industry-low .01%. This simply reflects the massive daily volume that trades in VTI due to its size. iShares Core S&P Total U.S. Stock Market ETF Our second competitor is from the iShares family of ETFs offered by BlackRock, Inc (NYSE: BLK ). BlackRock is another formidable competitor in the sphere of low-cost ETFs, with 19 ETFs featuring an expense ratio of .10% or less . Several of these are Bond ETFs with specific maturity dates so, for the sake of brevity, I show here the 5 ETFs with an expense ratio of .09% or less: (click to enlarge) ITOT is based on the S&P Composite 1500 Index . This index combines the legendary S&P 500, the S&P MidCap 400, and the S&P SmallCap 600 indexes, and covers some 90% of the total U.S. market capitalization. It covers companies with market capitalization of approximately $350 million or greater, with a median market cap of $3.3 billion. You may recall that SCHB’s median market cap is $1.9 billion, signifying that it contains a larger percentage of small-caps than does ITOT. NOTE: If you are interested in a nice visual representation of the scope of the various indexes, I found a wonderful graphic on the bogleheads website. ITOT has a 1.80% distribution yield, against 1.88% for VTI. The weighting of the Top 10 holdings is slightly more concentrated than VTI, at 15.12% vs. 14.00%. The fund is the smallest of our 3 competitors, with $2.4 billion in Assets Under Management (AUM). As a result, the average spread (see definition below) is .05% compared to .03% for SCHB and .01% for VTI. Key Comparative Information I have prepared the tables below as a quick visual comparative reference to help you evaluate the three ETFs side-by-side. First, some key high-level information: VTI, SCHB, and ITOT: Key Information VTI SCHB ITOT Assets Under Management (AUM) $55.6 Billion $5.0 Billion $2.4 Billion Index Tracked CRSP Total U.S. Market Index Dow Jones Broad Stock Market Index S&P Composite 1500 Index Number of Holdings 3,824 2,020 1,503 Weighting of Top-10 Holdings 14.00% 13.80% 15.12% Distribution Yield 1.88% 1.85% 1.80% Expense Ratio .05% .04% .07% Average Spread .01% .03% .05% Notes on terms that may be unclear: Distribution Yield refers to the ratio of distributions paid by the fund for the past 12 months divided by the Net Asset Value. Average Spread refers to the average price difference between the price buyers were willing to pay and sellers were willing to sell, averaged over the latest 45 days. Next, the sector breakdown: VTI, SCHB, and ITOT: Sector Breakdown VTI SCHB ITOT Financials 18.90% 17.90% 17.47% Technology 16.10% 18.70% 19.01% Health Care 14.00% 14.80% 14.92% Consumer Discretionary 13.80% 13.70% 13.01% Industrials 12.40% 10.50% 10.68% Consumer Staples 9.70% 8.40% 8.92% Energy 7.30% 6.80% 7.26% Utilities 3.00% 3.00% 3.04% Materials 2.80% 3.40% 3.44% Telecommunications 2.00% 2.00% 2.02% Other 0.00% 0.80% 0.23% TOTAL 100.0% 100.0% 100.0% Summary All three ETFs are worthy competitors. If you look at this YTD chart, you will see that VTI has a slight lead, and all three have outperformed the S&P 500. VTI data by YCharts If you look at this 5-year chart as a longer-term comparison, you will see that SCHB actually has a very slight lead over that time span, again with all three outperforming the S&P 500. VTI data by YCharts Setting aside the question of whether you can trade a particular ETF commission-free, here is my rating: VTI : In my mind, it was a very close battle between VTI and SCHB. Certainly, SCHB’s stunning .04% expense ratio is not to be ignored. Further, SCHB has slightly edged out VTI over the past 5 years. However, VTI’s slightly higher distribution ratio, huge size, extremely competitive .05% expense ratio, broader market coverage and recent outperformance nudge it to the #1 spot in my evaluation. SCHB : As I mention, this was a very close call. I think Schwab has done an incredible job putting together a world-class ETF for this category. I find it of no small note that SCHB has slightly edged out VTI over the past 5 years and its low expense ratio will doubtless make it extremely competitive as time moves forward. ITOT : Well, in a comparison of 3, one has to come out third. In this extremely tough head-to-head showdown, ITOT’s smaller size, .07% expense ratio and slight comparative underperformance weigh against it. On the other hand, its slight tilt toward large-caps might lower your risk in the event of a market downturn. I must say, however, that the question of which ETF you can trade commission-free may be the ultimate decider for you. Particularly will this come into play if regular, incremental, investments form a large part of your plan. Happy investing! Disclosure: I am/we are long VTI, ITOT. (More…) I wrote this article myself, and it expresses my own opinions. I am not receiving compensation for it (other than from Seeking Alpha). I have no business relationship with any company whose stock is mentioned in this article. Additional disclosure: I am not a registered investment advisor or broker/dealer. Readers are advised that the material contained herein should be used solely for informational purposes, and to consult with their personal tax or financial advisors as to its applicability to their circumstances. Investing involves risk, including the loss of principal.