Tag Archives: seeking-alpha

Large Investors Hate These Mutual Fund Sectors

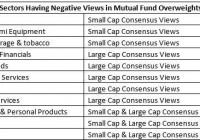
Previously we discussed sectors that made it to the love list of a Credit Suisse study titled ” Carving Up The Consensus: Comparing Hedge Fund, Mutual Fund, & Sell-Side Positioning By Industry Group, For US Large Cap & Small Cap “. Food and staples, retailing, real estate, pharmaceuticals, biotech and life sciences were loved across groups in the large cap category. For the small cap consensus, banks, health care equipment and services, and software and services enjoyed positive views. The analyst team for the study was led by Lori Calvasina and Sara Mahaffy, and they also found out sectors that were on the hate list of large investors. The research notes that it is difficult to find a consensus under all three sub heads – Sell-Side Ratings Relative to Market, Mutual Fund Overweights and Hedge Fund Net Exposure. However, Energy and Capital Goods in the large cap category had negative views under all sub heads. Sectors in the Hate List The list below shows those sectors that are on the hate list for Mutual Fund Overweights. Among these however, Energy and Capital Goods are the only sectors that were on hate list under all three sub heads for Large Cap Consensus views. For the small cap consensus views, there were no sectors that were in the hate list under all three sub heads. However, Household & Personal Products and Utilities were the other two sectors that had negative views under Mutual Fund Overweights for both Small Cap & Large Cap Consensus Views. What to Do with Funds? Energy The word “downturn” fits perfectly for the energy sector. Crude prices had slumped to below $50 a barrel. Thus, the profit margins of several players from the industry have seen massive declines. This has hit stock prices as well. The energy sector is definitely not a favorite of investors right now. Oil and natural gas prices – the backbone of the energy industry – have been disappointing them for quite some time now. Crude oil prices have nearly halved from the comparable period last year and natural gas prices have also remained low. Now, the Iran deal is a major headwind. After 20 months of negotiations, a nuclear deal has been reached between Iran and six world powers. Funds to Sell: BlackRock Energy & Resources Investor A (MUTF: SSGRX ) and Rydex Series Trust Energy Services A (MUTF: RYESX ) are two funds that investors may stay out of. Both these funds carry a Zacks Mutual Fund Rank #4 (Sell) . SSGRX invests a lion’s share of its assets in small cap companies related to sectors including energy, natural resources and utilities. SSGRX has lost 17.6% year to date and 45.2% over the last 1 year period. The 3 and 5 year annualized losses are 9.1% and 5.5%. It also carries a front end sales load of 5.25%. RYESX invests a majority of its assets in equities of small to mid-cap Energy Services Companies that are domestically traded. RYESX has lost 15.8% year to date and 47% over the last 1 year period. The 3 and 5 year annualized losses are 8.8% and 2.1%. It also carries a front end sales load of 4.75%. Capital Goods The other sector to have received an unfavorable rating under all three sub heads was Capital Goods. Coming under the broader Industrials sector, capital goods is defined by Investopedia as “category of stocks related to the manufacture or distribution of goods. The sector is diverse, containing companies that manufacture machinery used to create capital goods, electrical equipment, aerospace and defense, engineering and construction projects”. In first-quarter 2015, operating environment for the U.S.-based industrial equipment makers was difficult. Industrial production in the quarter declined 1% over the year-ago comparable period due primarily to weakness in the mining and utilities industries. Lower oil prices add to the woes, curtailing the capital expenditure on purchase of machinery and equipments. Funds to Buy: Fidelity Select Industrial Equipment Portfolio (MUTF: FSCGX ) currently carries a Zacks Mutual Fund Rank #1 (Strong Buy). Managed by the Fidelity Group, FSCGX invests at least 80% of assets in common stocks of companies principally engaged in the manufacture, distribution, or service of products and equipment for the industrial sector. FSCGX has returned 3.1% year to date and its 3 and 5 year annualized returns are 15.3% and 14.7%. It carries no sales load. Utilities Separately, the Utilities sector had an unfavorable rating for both small cap & large cap consensus views under the mutual fund category. The major headwind presently for the industry has less to do with its performance. A growing regulatory burden and increased debt loads remain a concern. But an even bigger issue is the interest rate backdrop, particularly with the Federal Reserve getting ready to start tightening monetary policy in the not-too-distant future. As high-yielding equity investments, utility stocks remain exposed to rising interest rates, as do fixed income investments. Higher interest rates mean increased cost of capital, a basic need of these operators given their ongoing need for investments. Just as their low-risk and high-yielding attributes make them a preferred choice during an economic down-cycle, a bullish economic environment makes utilities look a little wan and lusterless. Funds to Sell: The rate hike concerns are gaining strength as we move to the second half of the year, which is predicted by some to be the period to witness the rate hike. For investors not ready to take the risk, Rydex Utilities Advisor (MUTF: RYAUX ) and Gabelli Utilities AAA (MUTF: GABUX ) are two funds that they may stay away from. RYAUX carries a Zacks Mutual Fund Rank #5 (Strong Sell) and GABUX holds a Sell rank. RYAUX invests heavily in domestic equity securities issued by utility companies. It also holds derivatives, focusing on options and futures. RYAUX has lost nearly 8% year to date. Annual expense ratio of 1.84% is higher than the category average of 1.18%. GABUX invests a large share of its assets in domestic or foreign utility companies. GABUX focuses on acquiring common stocks which offer dividends. GABUX has lost 4.4% year to date. Annual expense ratio of 1.36% is higher than the category average of 1.18%. Link to the original article on Zacks.com

Why Investors Should Not Party Like It’s 1999

In 1999, it was the dot-com revolution that caused investors to ignore the exorbitant valuations and pitiful breadth. In 2015, it is the remarkably low cost of capital as provided by central banks worldwide that is causing investors to dismiss ridiculous valuations and dismal market internals. Stocks are super expensive today, much like they were in 1999. Yet are the stock market internals (breadth) genuinely as weak as they were back in 1999? No, they are not. The take home? Employ a tactical asset allocation strategy and stick with it. Tens of thousands of investors read my commentary at popular financial portals. Some have been reading my articles for more than a decade. Others might have clicked on a social media “follow” link in the last month or the last last year. Ironically, few realize that I originally developed a front-n-center persona on national talk radio in the late 1990s. The medium was unique in the way that listeners felt like they had a connection with me (a.k.a. “the G-Man”) and I felt connected to them. In fact, I felt a responsibility to help people understand investment mania as well as how to protect one’s self from devastating loss. Scores of folks in 50 some-odd cities may have listened for entertainment and perspective. On the other hand, many of those individuals did not take my words to heart. For instance, in 1999, I compared the stocks on the New York Stock Exchange (NYSE) with those that traded on the NASDAQ. The NYSE Composite had been flattening out over the final year-and-a-half of the 1990s whereas the NASDAQ Composite appeared to be charting a near-vertical course northward. Not only that, the records for the NASDAQ had been occurring on sky-high valuations and declining NASDAQ market internals (breadth). The bleak combination warranted caution. I did not tell investors over the radio airwaves to sell every equity holding. After all, the NASDAQ’s uptrend remained intact due to a handful of market-cap leaders still shouldering the work-load. Instead, I suggested tactical asset allocation shifts to prepare for the inevitable bearish turn somewhere down the pathway. Lighten up on the more aggressive holdings that had already experienced the greatest gains. Shift a bit to value. Raise cash equivalents for future buying opportunities. And pick up a bit more of investment grade bonds. The generalized recommendation to reduce the risk of loss was a winner in practice. Many who had lost 50%, 60%, 70% of their net worth pleaded for specialized asset management. Indeed, the 2000-2002 tech wreck is the reason that I was able to start my own Registered Investment Adviser that focused on the growth and protection of retirement portfolios. Flash forward to present day euphoria. The collective sentiment of the go-for-growth crowd is that central banks will never allow recessionary pressures to build; relatively low rates and/or the possibility of additional measures to create money electronically will be there to prop up equities should the economy or market confidence stumble. In 1999, it was the dot-com revolution that caused investors to ignore the exorbitant valuations and pitiful breadth. In 2015, it is the remarkably low cost of capital as provided by central banks worldwide that is causing investors to dismiss ridiculous valuations and dismal market internals. Are valuations really that ridiculous right now? Undoubtedly. And it does not matter if you prefer cyclically-adjusted price ratios (e.g., PE10), current price ratios (e.g., price-to-sales), the Buffett Indicator (market-cap-to-GDP) or a dividend yield-earnings yield combo. One can only decide that, like 1999, valuations no longer matter in a “New Economy,” or that 10-year returns for buy-n-hold will be woeful. In contrast, one could raise cash and less risky assets in his/her portfolio to buy at lower prices than currently exist. “Okay, Gary,” you concur. Stocks are super expensive today, much like they were in 1999. Yet are the stock market internals (breadth) genuinely as weak as they were back in 1999? No, they are not. That said, stock market breadth is noticeably shaky and growing shakier by the moment. Take a look at the ability of today’s NASDAQ to keep powering forward in price, albeit at a slightly slower pace, even as declining issues have started to overwhelm advancing issues. The similarity to the late 1990s is discernible. The take home? Employ a tactical asset allocation strategy and stick with it. By adjusting your portfolio’s mix when more caution is warranted, you will improve your risk-adjusted returns over time. For instance, when sky-high valuations couple with weak market internals, a 65% growth/35% income investor might downshift to 50% large-cap equity/30% investment-grade income/20% cash. Another person might be more risk averse, and decide that 40% large-cap equity/25% investment-grade income/35% cash places him/her in a better position to weather a future storm. Naturally, there is a flip side here. When low-to-fairly valued prices couple with improving market internals, a tactical asset allocation strategy would call for more risk. It would be time for the moderate investor described above to rebalance back to his preferred level of 65% growth/35% income. Moreover, the growth would likely include smaller-caps as well as higher-yielding income on the other side of the ledger. I recognize that not everyone wishes to engage a tactical asset allocation strategy. Fair enough. Still, those who paid attention when I addressed valuation and breadth concerns to a national audience in 1999 did not meet with disaster in 2000-2002; those who read my articles and recession warnings in 2008 did not experience the level of devastation that many experienced in the 2008-2009 financial collapse. Similarly, to the extent that you may experience apprehension about setting your portfolio on cruise control – to the extent that you wonder about the sense of holding onto the most aggressive securities in your accounts forever and ever – consider your alternatives. Perhaps hold onto assets like the iShares S&P 100 ETF (NYSEARCA: OEF ) , the Health Care Select Sect SPDR ETF (NYSEARCA: XLV ) and the iShares MSCI USA Minimum Volatility ETF (NYSEARCA: USMV ) ; perhaps let funds like the iShares Russell 2000 ETF (NYSEARCA: IWM ) go until the time that we have more attractive valuations and improving market internals (breadth). Disclosure: Gary Gordon, MS, CFP is the president of Pacific Park Financial, Inc., a Registered Investment Adviser with the SEC. Gary Gordon, Pacific Park Financial, Inc, and/or its clients may hold positions in the ETFs, mutual funds, and/or any investment asset mentioned above. The commentary does not constitute individualized investment advice. The opinions offered herein are not personalized recommendations to buy, sell or hold securities. At times, issuers of exchange-traded products compensate Pacific Park Financial, Inc. or its subsidiaries for advertising at the ETF Expert web site. ETF Expert content is created independently of any advertising relationships.

The Low Volatility Anomaly And The Delegated Agency Model

Summary This series offers an expansive look at the Low Volatility Anomaly, or why lower risk stocks have historically produced stronger risk-adjusted returns than higher risk stocks or the broader market. This article hypothesizes that the combination of a cognitive bias and an issue around market structure could contribute to the Low Volatility Anomaly. This article covers a deviation between model and market that may contribute to the outperformance of low volatility strategies. In the last article in this series , I demonstrated that the aversion of certain classes of investors to employing leverage flattens the expected risk-return relationship as leverage-constrained investors bid up the price of risky assets. In addition to the inability to access leverage for long-only investors, the typical model of benchmarking an institutional investor to a fixed benchmark (i.e. the S&P 500 represented through SPY ) could also potentially produce a friction to exploiting the mispricing of low volatility assets (represented through SPLV ). If a security with a beta of 0.75 produces the same tracking error as a security with a beta of 1.25, investors may be more willing to invest in the higher beta security with the belief that it is more likely to generate higher expected returns per unit of tracking error. In this framework, if the investor believes that the higher beta security is going to deliver 2% of alpha and that the higher and lower beta assets are going to have the same tracking error relative to the index, then the investor would not purchase the lower beta asset unless it was expected to earn alpha of more than 2%. An undervalued low beta stock with a positive expected alpha, but an alpha below the expected alpha of a higher beta stock with an equivalent expected tracking error, would be a candidate to be underweight in this framework despite offering both higher expected return and lower expected risk than the broad market. This investor preference results in upward price pressure on higher beta securities and downward price pressure on lower-beta securities that could be a factor in the lower realized risk-adjusted returns of higher beta cohorts depicted in the introductory article in this series . In a foreshadowing of the next article on the potential influence that cognitive biases have on shaping the relationship between risk and return, the difference between absolute wealth and relative wealth could be an important distinction that influences the behavior of delegated investment managers. Richard Easterlin (1974) found that self-reported happiness of individuals varied with income at a point in time, but that average well-being tended to be very stable over long time intervals despite per capita income growth. The author argued that these patterns were consistent with well-being depending more closely on relative income than absolute income. This preference for relative outperformance rather than absolute outperformance may signal why some managers think of risk in terms of tracking error rather than absolute volatility. In perhaps a more salient example, Robert Frank (2011) illustrated the relative utility effect through an experiment that showed that the majority of people would rather earn $100,000 when peers were earning $90,000 than earn $110,000 when peers were earning $200,000. Among the assumptions underpinning CAPM is that investors maximize their personal expected utility, but these studies suggest that investors in effect seek to maximize relative and not absolute wealth. Similar to leverage aversion detailed in the last article, the preference for relative utility could be another CAPM violation that contributes to the Low Volatility Anomaly. Gauging performance versus a benchmark is a form of maximizing relative utility, and has become an institutionalized part of the investment management industry perhaps to the detriment of the desire to capture the available alpha in our low beta asset example. I am not trying to minimize tracking error in my personal account, I am trying to generate risk-adjusted returns to grow wealth over time. As I have demonstrated in this series, academic research has shown that low volatility stocks have outperformed on a risk-adjusted basis since the 1930s. Disclaimer My articles may contain statements and projections that are forward-looking in nature, and therefore inherently subject to numerous risks, uncertainties and assumptions. While my articles focus on generating long-term risk-adjusted returns, investment decisions necessarily involve the risk of loss of principal. Individual investor circumstances vary significantly, and information gleaned from my articles should be applied to your own unique investment situation, objectives, risk tolerance, and investment horizon. Disclosure: I am/we are long SPLV, SPY. (More…) I wrote this article myself, and it expresses my own opinions. I am not receiving compensation for it (other than from Seeking Alpha). I have no business relationship with any company whose stock is mentioned in this article.