Tag Archives: seeking-alpha

Buy-Ranked Gaming ETF In Focus

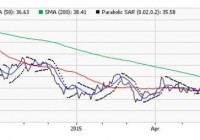
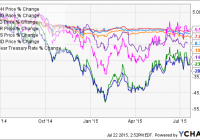
The once-thriving global gaming industry was badly hit by the slowdown in the Chinese economy that led to sluggish casino business in Macau – the world’s largest casino gaming destination. This is because the nationwide crackdown on corruption in China last year compelled Macau officials to impose restrictions on illegal money transfers in VIP gambling from mainland China to Macau. This has taken a toll on overall gambling revenues hurting the casino stocks at large. Additionally, smoking ban in casinos, tighter restrictions on visas and lower spending by high-stake gamblers added to the woes (read: 4 China A-Shares ETFs Pick Up After Gloom ). This 16-month bear trend now seems to be reversing with many casino stocks bouncing up from their lower levels. In particular, the U.S. casino giants like Las Vegas Sands (NYSE: LVS ), Wynn Resorts (NASDAQ: WYNN ), Melco Crown Entertainment Limited (NASDAQ: MPEL ) and MGM Resorts International (NYSE: MGM ) are up 4.5%, 2.6%, 5.5% and 1.5%, respectively, since the start of the second quarter. Hong Kong listed Galaxy Entertainment Group ( OTCPK:GXYEY ) added 5.6% while Sands China ( OTCPK:SCHYY ) moved higher by 15.1% so far this month. The impressive gains were brought in by the easing of tourist restrictions in Macau, and the possibility that bans on gaming-floor smoking rooms will be eased once operators maintain decorum and protect these rooms from harmful tobacco smoke. Effective July 1, mainland China passport holders transiting through Macau can stay there for two days longer and could gain entry into the city within 30 days instead of 60 days previously. This move will benefit casino operators in the months ahead. Further, the Chinese economy is stabilizing and casino operators in Macau are making efforts to diversify their businesses beyond gaming for additional revenue streams (read: ETFs to Play 3 Undervalued Sectors ). Apart from these, casino stocks seem extremely cheap at the current levels as the average valuation on Macau’s five biggest casino operators by market value has dropped to 18 times estimated earnings , about half of the peak reached in December 2013. This suggests an attractive point to enter the gaming market. Given this, investors could play this space with lower risk in a basket form rather than tilting toward individual companies. The Market Vectors Gaming ETF (NYSEARCA: BJK ) is the lone ETF providing investors global exposure to the casino gaming market. The fund has a Zacks ETF Rank of 2 or “Buy” rating with a High risk outlook (see: all the Top Ranked ETFs ). BJK in Focus This product follows the Market Vectors Global Gaming Index, holding 47 securities in its basket. It is concentrated on the top 10 holdings with the largest allocation going to Las Vegas, Galaxy Entertainment and Wynn Resorts that have combined to make up for 22.6% share. In terms of country exposure, U.S. takes the top spot at 36.8%, followed by China and Australia with 13% share each. The fund focuses on large caps at 56.2% while mid caps account for the remainder. From a style look, it has a nice mix of blend, value and growth securities, reflecting superior weightings. However, investors often overlook the fund as it has accumulated only $29.6 million in its asset base and trades in small volume of roughly 12,000 shares per day. This ensures additional cost in the form of wide bid/ask spread beyond the expense ratio of 0.65%, which is already at the higher end of the expense ratios prevailing in consumer discretionary ETF space. In terms of performance, BJK has been lagging the broad market and lost 24.2% in the trailing one-year period and 5.1% so far this year. But it recently broken its near-term range as depicted by the chart below, indicating some smooth trading in the weeks ahead. The fund’s short-term moving average (9-Day SMA) has managed to move ahead of the mid-term moving average (50-Day SMA) and is now treading toward the long-term (200-Day SMA) average, signaling upside for the fund. Further, the bullish trend is confirmed by the parabolic SAR, which is currently trading below the current price of the fund. Bottom Line Given the bullish technical indicators and improving fundamentals in Macau, investors could garner huge profits in the gaming industry with this top ranked ETF. Original post

A Comparison: Six Inverse Treasury Products

Summary With the possibility of an interest rate hike, investors should consider options for inverse leverage. I chose a basket of six comparable securities with varying degrees of inverse exposure to analyze. High yield bond and short treasury future combo ETFs are an interesting way to hedge against a potential rate hike. Introduction Recently, I’ve spent a considerable amount of time discussing how interest rates are going to rise. Investors should know how to capitalize on rising rates, so I’ve taken on the burden of analyzing every tool I can find that provides inverse exposure. If you want to learn more about rising rates , inverse hedging tools , and capitalizing on mentioned economic behavior, read the hyperlinked articles. Today, I will do a brief comp on six different tools that can be used for hedging against rates. Each of these ETFs and ETNs are fairly small (all under 200 Mil AUM), but for the individual investor looking for inverse exposure, they’re valid options that ought to be analyzed and considered. ETFs and ETNs for Inverse Treasury Coverage The six tools I will compare are: iShares Interest Rate Hedged High Yield Bond ETF (NYSEARCA: HYGH ), ProShares High Yield Interest Rate Hedged ETF (BATS: HYHG ), ProShares Investment Grade Interest Rate Hedged ETF (BATS: IGHG ), Barclays Inverse U.S. Treasury Aggregate ETN (NASDAQ: TAPR ), iPath U.S. Treasury 5-Year Bear ETN (NASDAQ: DFVS ), and PowerShares DB 3x Short 25+ Year Treasury Bond ETN (NYSEARCA: SBND ). HYGH HYHG IGHG TAPR DFVS SBND Average NAV 91.31 71.17 75.59 37.04 32.23 5.31 52.10833 Avg. Vol 7,143 19,191 17,655 4,080 4,282 59,285 18606 12-Mo Yield 5.85% 5.65% 3.52% 0% 0% 0% 2.503% Expense 0.55% 0.5% 0.3% 0.43% 0.75% 0.95% 0.58% Total Assets 105 135.22 166.3 24.45 3.94 42.52 79.57167 HYGH is a high-yield fund with positions in iShares iBoxx High Yield Corporate Bond ETF (NYSEARCA: HYG ) and short positions in Treasury futures. HYGH moves inversely to yields while providing high interest payments primarily through riskier bonds (avg. B rating). What HYGH lacks in volume, it makes up for in yields and exposure. Its 55 bps expense is fair. I would recommend HYGH for risk-taking investors seeking high interest payments and inverse exposure. For all intents and purposes, HYHG performs identically to HYGH. It is also a high-yielding bond ETF with built-in inverse exposure. I believe HYHG (yes, it’s confusing) is slightly better though because it holds a more diversified long portfolio, and it has more AUM. It also has a higher average bond quality (B+). Its expense ratio is lower as well (marginally) at 0.5%. HYHG is also more heavily traded on the market, which is beneficial to higher net worth investors. Finally, the last high-yield bond with inverse exposure is IGHG. IGHG has the most AUM; however, it has the lowest yields of the three. IGHG’s low yields are compensated by stronger underlying assets (average A – A- bond quality). DFVS, TAPR, and SBND are ETNs (with no income distributions) and expenses ranging from 0.58 bps to 0.95 bps that provide inverse exposure to Treasury yields. The benefit of an ETN is that it provides additional exposure, and the opportunity for higher returns (particularly in the short term). I believe there are better options on the market (like ProShares UltraShort 20+ Year Treasury ETF ( TBT), ProShares Short 20+ Year Treasury ETF (NYSEARCA: TBF ), and Direxion Daily 20+ Year Treasury Bear 3x Shares ETF (NYSEARCA: TMV ) for example). This article is for the sake of coverage and comparison. I will note that SBND resets monthly rather than daily. This monthly reset allows SBND to avoid some of the pitfalls inherent with tracking and compounding error . SBND is 3x leveraged, however, which comes with its own risks . Correlation To visually express correlation between these tools, and ten-year rates, I created a chart with each ETF/ETN. DFVS comes closest, though each security does generally follow the ups and downs of fluctuating rates. The Bond/Hedge combos are less volatile because they are composed of high-yield bonds (which don’t fluctuate as much) as well as Treasury futures. TAPR and SBND, because of time frame coverage and leverage, trade on a higher daily/monthly multiple than actual rates. However, in the long term, both TAPR and SBND will perform optimally over the other options if rate does trend upwards. SBND and TAPR should be avoided by the risk-averse investors. All mentioned securities show a desired level of correlation to Treasury rates. Conclusion HYGH, HYHG, and IGHG offer an interesting combination of income and inverse leverage. TAPR, DFVS, and SBND are pure ETNs that provide expected inverse exposure. The three ETNs are inferior to other options on the market in my opinion. The three Bond/Inverse combos, however, offer an interesting (potentially risky) avenue for long-term capitalization. Disclosure: I/we have no positions in any stocks mentioned, and no plans to initiate any positions within the next 72 hours. (More…) I wrote this article myself, and it expresses my own opinions. I am not receiving compensation for it (other than from Seeking Alpha). I have no business relationship with any company whose stock is mentioned in this article.

MCI: Telegraphing A Distribution Cut

Babson Capital Corporate Investors is an interesting high yield fund. With a focus on private debt, it resembles a business development company in some ways. Interested investors should note, however, that management is warning of distribution cuts ahead. Babson Capital Corporate Investors (NYSE: MCI ) is an interesting high-yield bond fund that invests primarily in private debt. There’s no doubt about it, this is a risky investment. And right now it might be even riskier than you think if income is your goal. Private debt MCI’s investment objective is to, “…provide a consistent yield while at the same time offering an opportunity for capital gains.” Although an odd wording, I read that to mean MCI looks to provide investors with a mixture of income and capital appreciation. It tries to reach these dual goals by investing in, “…privately placed, below-investment grade, long-term debt obligations of companies primarily domiciled in the U.S.” In other words, MCI buys high-yield debt from private companies or debt that isn’t traded freely in the public markets. That generally means the companies MCI is dealing with are small- to mid-size entities that either can’t tap the capital markets, or banks, for cash or don’t want to because the costs to do so would be too high. This can be a risky space to invest but also a very profitable one. In fact, in some ways, MCI is doing something similar to what business development companies do. As of the end of March, private debt made up around 60% of MCI’s portfolio. Along with the debt it buys, however, there are often warrants or other securities attached that either provide or can lead to owning equity in the issuing company. These are used as an incentive to do a deal since such securities provide some upside potential to investors. Thus, MCI’s portfolio also had about 17% of assets in private/restricted equity securities. The rest was mostly in cash or publicly traded high-yield bonds. On the surface this is an interesting way to tap into a market that investors simply can’t get at on their own. Although there are risks, since these are smaller and often lower quality companies, Babson is providing an experienced management team to help create a strong and diversified portfolio. So far, it’s done a solid job. Through the first half of 2015, MCI’s trailing annualized total returns over the one-, three-, five-, 10-, and 15-year periods are all above 10%. Those returns are based on net asset value, or NAV, and include the reinvestment of distributions. So, on aggregate, it’s hard to complain about the returns MCI has provided investors. However, before jumping in, you need to think about the purpose of owning this fund. Unsustainable? If you are looking at MCI for income, management’s comments in the March annual report should be concerning: “… it is likely that in 2015 we will have to reduce the dividend from the current $0.30 per share quarterly rate.” That $0.30 a share per quarter has been pretty consistent in recent years, why is it at risk now? The answer is two fold. First, according to management, “…net investment income is down due principally to the considerable reduction in the number of private debt securities in the portfolio resulting from the high level of exits and prepayment activity that has occurred over the last two years.” Second, and integrally related, high-yield debt markets are becoming less restrictive, allowing companies to issue public debt where they might otherwise have been pushed to work with MCI. This dynamic isn’t likely to change over the near term unless there is a severe market dislocation-in which case MCI’s NAV is likely to fall swiftly. Indeed, in a downturn the companies with which MCI works will be under stress and that fact won’t be lost on MCI shareholders. Sure, MCI may get more deals in a “bad” market, but it won’t feel good for MCI shareholders. This, then, is the big risk I see for income oriented investors in MCI. The CEF provides a yield of around 7.4%, but that may not be sustainable and there are other options with a similar yield that might expose you to less risk. If I was looking for income, I’d take a pass. But what about investors looking to get in on the private debt market? For such investors, MCI could still make a great deal of sense so long as income was a secondary consideration for you. In fact, even if MCI cuts its distribution, I wouldn’t expect it to be a massive haircut. A caveat or three There are three things to keep in mind here, however. First, MCI’s debt isn’t publicly traded so it has to price many of the securities it owns. There are guidelines for that, but there’s also a lot of leeway. If markets go south, it’s estimates of portfolio value could prove to have been overly optimistic. Second, even if its estimates are spot on, getting out of positions, especially in a difficult market environment, could be harder than you hope. Thus, it might be stuck in a bad holding with no place to go. Third, MCI has a history of trading at a premium to its NAV. Right now it’s a relatively low 3% or so, but that doesn’t change the fact that you are paying more than the portfolio is worth. The average premium over the trailing three years is around 13% and it’s been as high as 40%. So for investors looking to trade premiums and discounts, MCI should look enticing. But, if you buy CEFs because they allow you to buy assets for less than they are worth, MCI isn’t for you. Interesting, but… I took at look at MCI because a frequent reader requested it. I have to admit it’s an interesting CEF and I’m glad I did. If you own or are considering a business development company, or BDC, you should also look at MCI. That said, I don’t think it should be a core holding for most investors, but it could be a nice way to add a little spice to a diversified portfolio. Perhaps pushing some money that would otherwise go to high-yield debt into the CEF. But, based on management’s own warnings, the dividend isn’t sustainable right now. So, if you are looking for income to live off of, this is probably a bad option. Moreover, the nature of its holdings makes pricing an issue, particularly over short periods. So it would probably be best if you were willing to make a long-term commitment (say three to five years), unless all you care about are trading around premiums and discounts. Disclosure: I/we have no positions in any stocks mentioned, and no plans to initiate any positions within the next 72 hours. (More…) I wrote this article myself, and it expresses my own opinions. I am not receiving compensation for it (other than from Seeking Alpha). I have no business relationship with any company whose stock is mentioned in this article.