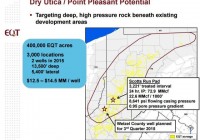
Summary EQT deep Utica test in SW Pennsylvania is successful and the 24-hour rate is exceptionally strong. The well validates the ultra-deep Utica concept in Pennsylvania and the result exceeds expectations. Continued success in dry Utica may have material consequences for the long-term natural gas supply/demand balance in the Northeast. East Coast LNG may be a logical solution, given the low cost and longevity of the expected supply. Those investors who are concerned that the Marcellus will run out of cheap natural gas too soon today have a reason to sigh with some relief – the Dry Gas Utica is standing by to help on the supply side and it is continuously proving to be a very capable helper. EQT Deep Utica Test Result – “Phenomenal” Is The Correct Word EQT Corporation (NYSE: EQT ) just reported results of its long-awaited Scott’s Run well completion in the Deep Utica in Green County in Southwestern Pennsylvania. (click to enlarge) (Source: EQT Corporation, June 2015) Due to the considerable depth and very high reservoir pressure, the well was challenging to drill and took more than half a year from spud to completion. The reason for the delay was associated with the need to replace the initial rig with a higher-spec rig to handle the reservoir pressure. However, EQT’s effort has been rewarded – the test is successful. The entire ~3,200-foot lateral length was successfully completed (EQT used 100% ceramic proppant). The entire amount of proppant was put away – no screenouts. According to EQT, the well was tested yesterday and had an average 24-hour rate of 72.9 MMcf/d with ~8,600 psi flowing casing pressure. Please note that this is a short lateral. EQT is trying to manage pressure at a reduced ~26 MMcf/d. The well is still cleaning up and pressure is still inclining. No EUR or decline rate estimate will be available for some time. The well came out at ~$30 million. However, this cost is clearly not representative of the expected cost in development mode. Going forward, EQT believes it can reduce its well cost in the Deep Utica to as little as $12.5 million for 5,400 foot laterals. In the immediate term, the well’s success is unlikely to materially change operational outlook for EQT (or any of its peers, for that matter). EQT is hoping to have a total of two-three wells on production by early next year and will plan further steps based on the performance results. EQT believes that it has ~400,000 net acres prospective for dry Utica, including ~50,000 net acres that look geologically “identical” to the announced well. The Significance of EQT’s Test EQT’s well result extends the technical boundary of the Deep Dry Utica play and implies that the play’s economic sweet spot may be very large in size. EQT’s Scott’s Run well is located almost 2,000 feet downdip from Range’s highly successful Sportsman’s Club well that Range brought online in December of last year. Simply eye-balling the contour made of the most productive Dry Utica wells from Ohio to West Virginia Panhandle to Southwest Pennsylvania and looking at geologic correlation charts, the size of the potentially productive area appears very large, with an enormous amount of natural gas in place. (click to enlarge) (Source: Range Resources, June 2015) There is obviously a strong read-across from this result to several peer operators in the area, including Range Resources (NYSE: RRC ), Rice Energy (NYSE: RICE ), Southwestern Energy (NYSE: SWN ) and several others. Range Resources’ Deep Utica Test EQT’s well is the second successful deep Utica test in Southwestern Pennsylvania. As reminder, late last year Range drilled its Claysville Sportsman’s Club #11H test in Washington County, PA to test Deep Dry Utica. The well achieved an average 24-hour rate of 59 MMcf/d flowing against simulated pipeline pressure and conditions (Range did not provide the choke data). The well was drilled and cased to a true vertical depth of 11,693 feet with a 5,420-foot horizontal lateral completed with 32 frac stages. Range reported that the formation was strongly over-pressured – the company’s initial calculations indicated a 0.88 psi/foot pressure gradient. The overpressuring contributed to the extraordinary initial production rate that equated to a 10.9 MMcf/d per 1,000 foot of lateral. The well remained shut-in for approximately 90 days while production facilities were being completed. After the well was brought on production under a managed-pressure restricted flow program, it produced 1.4 Bcf of gas in the first 88 days, or ~16 MMcf/d on average. Range believes that the Sportsman’s Club #11H result confirms the company’s geological interpretation. Range has ~400,000 net acres under lease in the Southwest Pennsylvania area which it considers prospective for the Utica/Point Pleasant play. The company recently cased its second deep Utica well drilled off the same location – the well is expected to be completed in Q3 2015. (click to enlarge) (Source: Range Resources, June 2015) Drilling Economics Are Promising Despite The High Well Cost The Dry Utica is already in development mode on the play’s western flank where wells are much shallower and, therefore, less technically challenging and less expensive to drill. The following chart from Rice Energy’s recent presentation shows a remarkably consistent performance of the first several wells that the company drilled in Belmont County, Ohio. The geology in that area correlates with the geology in Southwestern Pennsylvania. (click to enlarge) (Source: Rice Energy, November 2014) Sweet Spots And The Choice Of The Landing Zone Are Key Given the relatively high drilling and completion cost in the deep Utica and competitive capital allocation, the bar for well performance is set very high. The porosity cross-section charts below highlight the significant variability in the rock’s petrophysical characteristics depending on location. The charts also highlight that the formation is thick and has a complex structure. Therefore, the choice of the landing zone and completion design may be significant drivers of well productivity. Given that operators have just initiated their evaluation programs, the play has upside in the form of inventory high-grading (focusing on sweet spots) and play-specific technical learning curve. (click to enlarge) (Source: Range Resources, June 2015) (click to enlarge) (Source: Rice Energy, June 2015) Is Deep Dry Gas Utica Prospective In Northeast Pennsylvania Too? Last year, Royal Dutch Shell (NYSE: RDS.A ) (NYSE: RDS.B ) made public the results of its first two deep Utica exploration tests, the Neal and Gee, located in Northeast Pennsylvania, in Tioga County, over hundred miles to the northeast from Range Resources’ Sportsman’s Club well. I estimate that the wells were drilled to a true vertical depth of approximately 11,500 feet. Both wells had been on production for a significant period of time and are prolific producers. The Gee had been on production for nearly one year, and had an initial flowback rate of 11.2 MMcf/d from a ~3,100-foot lateral, which equates to ~3.6 MMcf/d per 1,000 feet of lateral length. The Neal began production in February of 2014, and had an observed peak flowback rate of 26.5 MMcf/d from a ~4,200-foot lateral, which equates to ~6.3 MMcf/day per 1,000 feet of lateral length. Shell did not provide any information with regard to the wells’ cumulative production, pressure metrics or completed cost. The company commented, however, that both wells were high-pressure wells and their “results are comparable to the best publicly announced thus far in the emerging Southeast Ohio Utica dry gas play.” Shell was awaiting results from four additional Utica wells drilled in Tioga County. Shell’s results suggest that Deep Dry Utica prospectivity may not be limited to Southwestern Pennsylvania. In Conclusion… While the dry gas Utica/Point Pleasant potential has been identified by the industry several years ago, the play remains in an early stage of its life cycle. The total number of test wells drilled in the Utica’s dry gas window is still miniscule – few dozen in total – and is dwarfed by the number of wells completed in the Marcellus or in the Utica’s wet gas and condensate windows. Perhaps the most interesting aspect of this play is that its limit on the eastern flank – geologic or economic – is yet to be established. EQT just extended that limit another 2,000′ feet further downdip. Inevitably, wells in the deep portion of the play will initially be challenging to drill and costs may be high. Most importantly, technical risks are also elevated. However, the longer-term outlook for the play appears very bright. Well results in the dry gas window so far have exceeded most optimistic expectations and suggest that the deep Utica, in its most productive areas, may rival Marcellus’ sweet spots in terms of drilling economics and will substantially extend the region’s already formidable discovered resource base. The progress that the industry is making in the Deep Utica suggests that dry gas supply potential in the Northeast may be substantially greater than was visible initially. This may necessitate a search for strategic takeaway solutions for natural gas production from the region. The concept of East Coast LNG appears increasingly compelling. New projects initiated now would probably come in service just in time to handle the potential capacity ramp up in the Deep Utica. Deep Utica will not have significant impact on operators’ production volumes in the Marcellus/Utica area (takeaway capacity determines production volumes). However, the presence of another prolific zone in the stack will extend the productive life of the acreage. The addition of the deep Utica drilling inventory should provide greater certainty to infrastructure developers in the region and have a positive impact on infrastructure development. Stock valuations will have meaningful positive uplifts as Utica gas should support the “higher for longer” production expectation. What Stocks Benefit Most From EQT’s Announcement? The most significant read-across from EQT’ deep Utica test would be to the following stocks: Southwestern Energy Noble Energy (NYSE: NBL )/CONSOL Energy (NYSE: CNX ) Joint Venture Chevron (NYSE: CVX ) Rice Energy Range Resources XTO/Exxon Mobil (NYSE: XOM ) Disclaimer: Opinions expressed herein by the author are not an investment recommendation and are not meant to be relied upon in investment decisions. The author is not acting in an investment, tax, legal or any other advisory capacity. This is not an investment research report. The author’s opinions expressed herein address only select aspects of potential investment in securities of the companies mentioned and cannot be a substitute for comprehensive investment analysis. Any analysis presented herein is illustrative in nature, limited in scope, based on an incomplete set of information, and has limitations to its accuracy. The author recommends that potential and existing investors conduct thorough investment research of their own, including detailed review of the companies’ SEC filings, and consult a qualified investment advisor. The information upon which this material is based was obtained from sources believed to be reliable, but has not been independently verified. Therefore, the author cannot guarantee its accuracy. Any opinions or estimates constitute the author’s best judgment as of the date of publication, and are subject to change without notice. The author explicitly disclaims any liability that may arise from the use of this material. Disclosure: I/we have no positions in any stocks mentioned, and no plans to initiate any positions within the next 72 hours. (More…) I wrote this article myself, and it expresses my own opinions. I am not receiving compensation for it (other than from Seeking Alpha). I have no business relationship with any company whose stock is mentioned in this article.