Tag Archives: seeking-alpha

JPN: A New Way To Invest In Japan

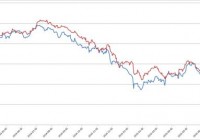
Summary Barron’s says it’s time to get long Japan. Deutsche Bank listed a new Japan ETF at the end of June. This new ETF may be an excellent way to buy Japan. On July 18th, Barron’s published an article titled, ” Time to Buy Japan’s Blue Chips .” Given that, and given that some investors may be seeking to gain exposure to Japan, I thought I would discuss and analyze one of the newest ways to get long Japan. The Deustche X-trackers Japan JPX-Nikkei 400 Equity ETF (NYSE: JPN ), freshly listed on June 24th, is Deutsche Bank’s newest Japan ETF, and the first U.S. listed ETF that tracks the JPX-Nikkei 400 Index. In this brief analysis, I will take a look at the underlying index that JPN tracks, how the fund is structured and how it compares to another Japan ETF. The Underlying Index To begin my analysis of JPN, I will first describe how the underlying JPX-Nikkei 400 Index works. This index is based on the 400 highest scoring (more on the “score” in a moment) listings from the JASDAQ and TSE. The scores are based on a four-part selection process, which begins with this screening: Listed for at least 3 years Must be common stock More assets than liabilities in the last 3 fiscal years No operating or overall deficit in the last 3 fiscal years Not designated to be de-listed After this initial screening, the top 1000 listings are selected based on market cap and trading value from the last 3 years. Those 1000 listings are then scored based on quantitative factors: 3-year average Return on Equity (40% weighting) 3-year cumulative operating profit (40%) Market capitalization (20%) Then, scoring based on qualitative factors is added where present: Appointment of independent outside directors Adoption of IFRS (International Financial Reporting Standards) Disclosure of English earnings information The top 400 listings are selected from the 1000 initially screened. I would also note that no single component makes up more than 1.5% of the index. Components JPN consists of 284 holdings. The fund is heavily weighted in industrials (20.28%), financials (18.96%), and consumer discretionary (17.08%). The top 10 holdings are as follows: KDDI Corporation ( OTCPK:KDDIY ) (Telecommunications – 1.83%) Nippon Telegraph and Telephone (NYSE: NTT ) (Telecommunications – 1.83%) Mitsubishi UFJ Financial Group (NYSE: MTU ) (Financials – 1.75%) Toyota Motor Corp (NYSE: TM ) (Consumer Goods – 1.62%) Mizuho Financial Group Inc (NYSE: MFG ) (Financials – 1.59%) FANUC LTD ( OTCPK:FANUY ) (Industrials – 1.55%) Japan Tobacco ( OTCPK:JAPAY ) (Consumer Goods – 1.54%) Mitsui Fudosan Company ( OTCPK:MTSFY ) (Financials [Real Estate] – 1.52%) SMC Corporation ( OTCPK:SMCAY ) (Industrials – 1.50%) Central Japan Railway Co. ( OTCPK:CJPRY ) (Services – 1.49%) Given that there is no major concentration in any one listing, I would say that this ETF is fairly well diversified. However, it is heavily weighted in the 3 aforementioned sectors, which make up a combined 56.32% of the portfolio. The other 43.5% of the portfolio comes from a combination of information technology, consumer staples, health care, telecommunication services, materials, utilities, energy, and “other.” The least represented sectors are utilities and energy, each at < 1%. Comparison to EWJ One of the most popular and liquid Japan ETFs is the iShares MSCI Japan ETF (NYSEARCA: EWJ ). EWJ provides "targeted access to 85% of the Japanese stock market" by tracking the MSCI Japan Index. MSCI's broad index composition methodology is based on market capitalization and liquidity. In this regard, EWJ's underlying is less selective than JPN's underlying. As a result, the MSCI Japan Index is currently up 14.36% YTD while the JPX Nikkei-400 Index is up about 17.50% YTD. EWJ has the same top 3 sector representations, although they are weighted differently. The most weighted sector in EWJ is consumer discretionary (22%), followed by financials (19.64%) and industrials (18.90%). EWJ is also arguably less diversified, with over 9% of the portfolio's value held in just two listings (Toyota Motor Corporation at 6.11% and Mitsubishi UFJ Financial Group at 3.05%). EWJ's expense ratio, at .47%, is marginally higher than JPN's, which is .40%. Just for reference, other Japan ETFs include: WisdomTree Japan Hedged Equity ETF ( DXJ) WisdomTree Japan SmallCap Dividend ETF ( DFJ) Deutsche X-trackers MSCI Japan Hedged Equity ETF ( DBJP) iShares Currency Hedged MSCI Japan ETF ( HEWJ) Conclusion My personal opinion is that JPN may offer better aimed exposure than EWJ because it tracks an underlying that adheres to a more strict selection process. However, a prospective investor should note that it is fairly illiquid right now, given that it is brand new. Furthermore, it should also be noted that there are other Japan ETFs that are currency hedged, which some may prefer depending on one's view of current macroeconomic conditions. While it is still early in the life of JPN, I think it is a fund worth further investigation if one of your goals is to be invested in quality Japanese equities. Disclosure: I/we have no positions in any stocks mentioned, and no plans to initiate any positions within the next 72 hours. (More...) I wrote this article myself, and it expresses my own opinions. I am not receiving compensation for it (other than from Seeking Alpha). I have no business relationship with any company whose stock is mentioned in this article. Additional disclosure: This article is not intended to be a recommendation to buy or sell Japanese equities. It is intended simply to break down a new product that may be useful to investors who have a long bias on the Japanese equity markets.

Patience And Liquidity

The continued drop in commodity prices raised fears in the financial markets that global growth was slowing to a crawl. The result? Bond prices rose while stock prices fell. It is clear that there is overproduction relative to demand in most commodities. This is highlighted by energy. Prices continued to decline last week. Each commodity has its own dynamic but in virtually all cases production is increasing year over year at a rate surpassing demand growth. The key takeaway is demand and production are increasing. Major producers are finally cutting back production to levels equal to or beneath demand growth so that inventory levels stabilize or actually decline, which is a prerequisite for pricing power moving forward. It will take time and patience. Unfortunately there is a lot of speculation in the commodity markets and continued weakness in prices initially led to margin calls and now outright liquidation. Markets typically move too far each way. Fear of a further collapse in the commodity markets has spilled over into other financial markets creating opportunities for investors who have been patient and maintained their liquidity. I have stated that lack of or no growth was my biggest fear. But let’s put all of this in perspective: the U.S. economy is improving led by the consumer; China reported 7.0% growth last quarter and its stock market has rebounded of late; Greece is settled, at least for now, lifting a big cloud over Europe which will lead to renewed growth; Japan is doing fine led by exports; India is continuing to accelerate and will grow over 7% this year however many third world countries are suffering. The world is growing over 3.0% this year which may be less than in the past. Global growth should improve in 2016, too. Don’t forget that the drop in oil prices recently from $60 dollars per barrel to around $48 per barrel will boost consumer disposable income around the world and lower inflationary expectations boosting bond prices from what they otherwise would be at this point in the economic cycle. Beside the consumer, the drop in energy and other commodity prices are good for corporate margins in the aggregate but of course not for the commodity producers themselves. By the way, we added to our energy shorts after it appeared that a deal would be reached with Iran, which we discussed in previous pieces. It was an easy call. Over 70% of companies reporting so far have exceeded their forecasts for the second quarter and maintained or raised numbers for the year. Not too bad. Rather than reviewing events by region as we have done in the past, I’d like to review my core beliefs and see if there are any changes that may influence my investment policy: Monetary policy remains easy virtually everywhere and the supply of funds is exceeding the demand for funds, which is favorable for financial assets. It is clear that the Fed is on hold until year-end or early 2016 at the earliest removing an immediate concern in the marketplace. The dollar has remained the currency of choice, which may impede U.S. economic growth but also lowers inflationary expectations. Positive capital flows from abroad continue to reduce our interest rates from what otherwise they would be. The yield curve will steepen but the degree may be less than initially thought due to the sharp drop in commodities, weakness overseas and strength in the dollar reducing inflationary expectations further. A new conservatism permeates governments, corporations and individuals is clearly true. Just look at new Fed rules for the banks and at corporate cash flow reported for the second quarter so far. Hillary Clinton’s tax proposals are not good for the economy, capital formation and investment but may improve the Republican’s chances in the next Presidential election. Profits will surprise on the upside clearly occurred with second quarter results reported so far. Financial leverage and capital ratios will continue to improve. Clearly this is the case as most corporations are capping capital spending at depreciation therefore generating a lot of free cash. Banks continue to raise capital ratios and reduce leverage and risk. M & A activity will remain strong. Just look in the newspapers every day to see deals of all sizes. Both the acquirer and the acquired company’s stocks rise, as most deals are anti-dilutive day one. Commodity prices continued to decline as producers remained slow to cut back production at levels to or beneath demand growth so inventories continued to rise and prices fell. But lower commodity prices are good for inflation, interest rates and profit margins. Not for commodity companies though. Corporate managements are acting as their own activists recognizing that change is a necessity to survive and thrive in a globally competitive landscape. A Greek default was contained although I doubt that Greece can live up to the terms of its new deal with the ECB. The can was kicked down the road. I still doubt that the Fed can begin raising rates until 2016 and overall policy will remain easy. Future rate hikes will be small and spread out unless there are major changes in the outlook for the U.S and global economies. The economic cycle will be extended with lower highs and higher lows. Still valid. There are few, if any, excesses. Speculation exists today in real estate, private equity and art. Still valid. My beliefs remain for the most part intact. I continue to be pleasantly surprised by how managements are adapting to this global competitive environment. Management is everything to me. There is a reason why Alcoa, Dow Chemical, GE, Honeywell, Nucor, JP Morgan Chase, Wells Fargo are best in class. Then take a look at Facebook, Google, Apple, Starbucks, Visa to name some more. I am long 25 of the best managements in the world who have winning long-term strategies regardless of the economic environment. And that is the key to be a successful investor. Be patient and maintain ample liquidity at all times to take advantage of market moves like last week. While change is in the air it does not happen overnight. Follow your beliefs and challenge them at all times. Invest in stocks, not markets. Invest accordingly! Share this article with a colleague

Freeport-McMoRan: A Lesson In Listening To The Model

Summary After I designed a model that was surprisingly effective at predicting movements in Freeport-McMoRan, I stopped listening to it. The model was clearly predicting the latest crashes in Freeport-McMoRan. As bad as things are for Freeport-McMoRan, the commodities suggest current pricing is pretty fair. Freeport-McMoRan (NYSE: FCX ) has been in freefall for the last month or so. There have been great opportunities to get out, but I missed them because I was focused on doing analysis on other parts of the market. This is a story of the massive mistake I made and how easily it could have been prevented. Predicting Commodity Prices From the start, I’ve said that my goal is not to predict commodity prices because predicting which way the prices will move is not within my skill set. When I make investing decisions, I want to be functioning within my area of expertise. When it comes to Freeport-McMoRan my area of expertise was building a model that was vastly better at predicting returns than I could be relying on any other tool. Despite knowing that my area of expertise was in building the model, I allowed myself to be swamped with work and didn’t return to regularly run my model the way I did during my first stint investing in Freeport-McMoRan. How I Should Have Done It The best method for me would have been to write it into my schedule that at least every week I had to completely rerun my model and decide if the stock was worthy of investment at that point given the results. Unfortunately, I didn’t do that. I ran the model around June 7th, decided it was getting risky and posted my downgrade and intent to keep running the model and watching for strong indicators to get out. The proper choice, clearly, would have been to sell out immediately rather than looking to get a tiny bit of extra return relative to my index by holding the position. Let this be a lesson to all investors to keep a close eye on those volatile investments. At the same time, it would have been wise for me to make some improvements to make the model easier to update. That may have encouraged me to keep checking it every day rather than allowing my early summer days to become swamped with other activities. I’ve taken both of those lessons to heart. The saddest irony, as you’ll see, is that the spread widened further, precisely as I predicted over the next couple weeks. Part of that time was when I was out of the state and away from my model. Clearly, I should have closed out the position before I left. Getting Up to Date I reran my model which uses the opening values for shares of Freeport-McMoRan along with the opening values for different ETFs that track 4 of the 5 commodities Freeport-McMoRan produces. I use those ETFs to track the estimated price change in futures contracts on the commodities as a way of seeing where commodity prices are going. Occasionally Freeport-McMoRan will move before the futures prices on the commodities but a large divergence has been a clear sign that a correction is coming. In using those commodities I built my model to predict average annual EBITDA for FCX over the next couple of years and then set a standard deduction from that value to estimate the other necessary cost implications because interest, depreciation and amortization are very real costs. Taxes is also a real cost, but will generally scale in such a way that it is automatically accounted for in my model. That should sound very complex to readers that didn’t see my previous work on Freeport-McMoRan, but the charts are easy enough to read. The chart below shows the values for EBITDA minus the static. As you can see, the lines show a very strong connection. (click to enlarge) While I like that method for looking at the correlation over the long term, I prefer to actually read the output using bar charts. The following chart shows the values for the last seven months: (click to enlarge) I designed these charts using the opening values for each ticker. We don’t have the opening value for Monday, so I inserted the closing prices for Friday, July 24th as “July 25th”. As you can see, over the last couple months the shares have fallen significantly but not by near as much as the expected earnings. Contrary to popular belief, Freeport-McMoRan stock was actually holding up well if we compare it to the fundamental earning power of the company. You may notice the left side of the chart is done in percentage terms. I standardized all the values in that chart based off the values from the start of 2014. There is no reason to think that the values from the start of 2014 were perfectly aligned, but it made it possible to reliably get both bars onto the same scale to compare relative strength. Relative Strength I put together another chart that makes it even easier to read. This chart standardizes based off percentage change from the values on May 20th. (click to enlarge) Had I been disciplined enough to force myself to update the spreadsheet more regularly, I would have been out without a problem. I’m providing an even larger version of the very clear “Get the **** out” signal: By the middle of June the model was sending off extremely strong sell signals. When I tried to do an eyeball test of the movement by simply looking at price charts in early July, I thought the commodities were moving before Freeport-McMoRan and started to doubt my model. If I had updated it completely, I would have seen that Freeport-McMoRan was simply catching up with the losses the model was predicting and I would’ve got the heck out. What Does It All Mean for Freeport-McMoRan? Based on my model, the closing values put us fairly close to fairly priced. That makes decisions to buy or sell fairly neutral. The biggest concern on buying is that the volatility is enormous. I’ll be putting in some work to make the model easier for me to update and then I’ll be watching for another one of those clear buying or selling signals. At the moment the model is quite neutral since the red line is only mildly taller than the blue. This wasn’t a case of my model failing me, it was me failing the model and paying dearly for it. I designed my system around having an index of ETFs that I could use as my benchmark. This is the same batch of ETFs that I use in estimating EBITDA based off commodity futures contracts. Relative to the benchmark, I’m “winning”. The benchmark is down 52.4% and FCX is down 48.4%. Somehow, this doesn’t feel like winning. Disclosure: I am/we are long FCX. (More…) I wrote this article myself, and it expresses my own opinions. I am not receiving compensation for it (other than from Seeking Alpha). I have no business relationship with any company whose stock is mentioned in this article. Additional disclosure: Information in this article represents the opinion of the analyst. All statements are represented as opinions, rather than facts, and should not be construed as advice to buy or sell a security. Ratings of “outperform” and “underperform” reflect the analyst’s estimation of a divergence between the market value for a security and the price that would be appropriate given the potential for risks and returns relative to other securities. The analyst does not know your particular objectives for returns or constraints upon investing. All investors are encouraged to do their own research before making any investment decision. Information is regularly obtained from Yahoo Finance, Google Finance, and SEC Database. If Yahoo, Google, or the SEC database contained faulty or old information it could be incorporated into my analysis.