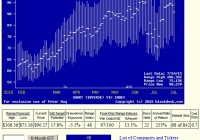
Summary The VIX Index is a measure of the recent past, not a forecaster of the near future. Its ongoing price behavior can be interpreted by behavioral analysis to imply probable near term ranges of future price activity limits. Those forecast ranges occasionally offer odds-on, high-return, profit potentials by use of ETFs, leveraged or otherwise. Market timing? Can it actually be done? You bet – it has been, frequently, with significant payoffs. Take a look at the experiences with the ProShares Short VIX Short-Term Futures ETF. A Quick Review of the VIX and the Market The VIX index measures the recent past amount of uncertainty in the principal stock market index, the S&P 500 (SPX). The measurement is implied by prices being paid by investor/speculators in options on the SPX, through a well-known analysis process called “implied volatility.” When stock prices rise, implied vols (and the VIX index) go down; when stock prices go down, the VIX rises. For a more complete perspective, see the SA article “Dog days of Summer”. This inverse relationship of VIX prices to stock index prices complicates thinking about profiting from the VIX. What is needed for comfortable thinking is a vehicle that offers a price action that is inverse to the VIX Index. For the individual investor, one that is advantageous in many dimensions is the ProShares Short VIX Short-Term Futures ETF (NYSEARCA: SVXY ). The SVXY has been in existence since fourth quarter 2011, for some 3+ years, and options have been trading on it starting about six months later. As a full-fledged ETF it has pricing veracity that is market-verified and supported, without the sponsor-creditworthiness value overlay questions of an ETN. An alternative to SVXY is the VelocityShares Daily Inverse VIX Short-Term ETN (NASDAQ: XIV ), which has a slightly longer history, but no options trading. The lack of options prevents its price range forecast capability, which will become an apparent critical limitation. Behavioral Analysis Forecasts of SVXY Price Range Prospects Regular readers of our articles understand that we can translate into coming price range expectations of securities the hedging done by market-makers [MMs]. That hedging is a form of price protection for firm capital put at risk as they provide market liquidity to temporarily fill the imbalances caused by volume transaction orders of big-$ fund portfolio manager clients. Here is how the recent trend of those derived expectations has compared with the market quotes of SVXY at the time of their forecasts. Figure 1 (click to enlarge) (used with permission) The vertical lines in the picture are not past actual market prices experienced by the subject, but are expectations of the range of prices that could be experienced in coming weeks and months. Those expectations are implied by the prices demanded by sellers of hedges, willingly paid by MM buyers of price protection hedges, and considered as acceptable market liquidity supporting costs by their clients, real-money transaction initiators. The heavy dot in each day’s line is the closing price of the subject at the time of the forecast, and divides the expectations into upside and downside prospects. Those proportions are measured daily by the Range Index, which tells what percentage of the whole range lies below the current market quote. The small thumbnail picture at the bottom of Figure 1 shows the distribution of those Range Indexes over the 842 day life of this ETF. Many things can influence the expectations for coming prices of this underlier, but it turns out that historically the size of the Range Index has had pertinent implications for its subsequent actual market quotes. A daily maintained actuarial record supports the displayed row of data between these pictures. Using the Range Index of the day for SVXY of 48, a quick visual check of the most recent forecast vertical range at the right of the picture confirms that the market quote then of $90.27 was about in the middle of the forecast range of from 75.16 to 106.36. In the ETF’s life of 842 market days there had been 68 days with a similar Range Index. Taking all 68 of those experiences, 66 had prices either reach the top of their forecast range within 3 months, or by the end of that time a closeout of the position called for by the holding period limit of 3 months would be at a profit, compared to SVXY’s closing price position cost the day after the forecast. The other 2 would produce losses. Combining winners and losers created an average payoff per position of +13.1%. But because many of the 64 reached their targets quickly, while the losers both had to be held a full 63 market days, the average holding period for all 68 was only 25 market days. In a year of 252 market days that +13.1% net gain, compounded ten times amounts to an annual rate of +253%. Is active investment management, profit compounding, real? To provide live confirmations of what can be done with Market-Maker forecasts and robust exercise of the T ime- E fficient R isk- M anagement D iscipline [TERMD], starting at the beginning of 2015 we began issuing to subscribers daily lists of our top 20 ranked stocks and ETFs. The ranking schema valued a tradeoff between MM upside price forecasts and prior experience of worst-case price drawdowns experienced during TERMD holding periods subsequent to forecasts similar to the day’s. Careful actuarial records of complete experiences, issue by issue, day by day, since the start of this century support the data shown in Figure 1. Figure 2 spells out the specifics of the 6 instances of SVXY recommendations made in real time, as seen by some of our subscribers on lists from the days indicated. Figure 2 (click to enlarge) As can be seen, the six completed buy positions all produced double-digit gains (column 19) in holding periods ranging from 9 calendar days to 53, producing triple-digit rates of gain, and 79% of profit in less than 6 months. It should also be noted that on each day SVXY competed with over 2500 other equity investment candidates to be on the top 20 lists. In its most successful six days (out of over 140) there were 19 other able competitors, and in the other days, 20 more able. The competition is a function of columns (5), (6), and (8), conditioned by (13) and (12). Column (15) is a composite measure weighting (5) by (8) and (6) by 100-(8) to make an odds-weighted reward vs. risk tradeoff based on the actual prior experiences of forecasts like today’s (7) as counted in (12) out of those available in the past five years (12). These elements are all identical factors in any of the 2500+ competing candidates, making it possible to directly evaluate their likely futures based on the way Mr. Market has subsequently treated the previous forecasts made by the MMs. This is no more of a technical analysis, because it is a comparison of price forecasts, than is any comparison of likely future price-earnings estimates made by fundamental analysts. The power of behavioral analysis In fact, the price forecasts of MMs include all the known fundamental analyst P/E estimates, their earnings and earnings growth estimates, appraisals of competitive trends, foreign currency translations, political influences, likely weather impacts, cultural trends in other geographic markets for the subjects’ products, and most importantly, the flow of volume stock transaction orders issuing from portfolio managers at MM big-$ investment funds that have the money muscle to move market prices. This is what behavioral analysis of investing is all about, where money meets the market, through people negotiating with one another, usually in informed, experienced combative contests of significant size. Academic musing over illusions and the mistakes humans at large may make may be entertaining, but it has proven to be years of fruitless effort in terms of developing any productive investment advantage. On the other hand, carefully-performed insightful analysis of day-by-day actions being taken by experienced, informed practitioners putting capital at risk and protecting against the risks they deem likely, tells a great deal about the investment subjects at hand in risk~reward terms and about the skills of the appraisers. Especially where they all are dealing in an environment that is competitively impossible to rig and is motivationally sound. Over 15 years of 252 market days and more than 2,500 equity security subjects each day have been collected from an unchanging evaluative model to provide an actuarial resource of multi-millions of price range forecasts and their actual market outcomes. Some, like SVXY, turn out to be enormously valuable, many others are so much GIGO. Knowing which is which should be helpful to individual investors who lack the MM’s extensive information-gathering resources of people, man-hours, and money. We take the posture of leveling the playing field for many investors who have often been treated unkindly, or in some cases not even fairly, by the investment establishment. Like several others who have reached the stage in their lives where they recognize it is time to give back to the civilization that has benefited them, we choose to do it by sharing our information with those who for whatever reason are behind schedule in their balance between wealth-building investment milestones and their financing objectives and needs. Over the years we have learned that free goods are rarely appreciated, often disdained, and in investing tend to lie unused. So we pose a trivial charge for our information to separate those who simply will grab anything the system gives them for free. Since the beginning of 2015 we have provided top20 ranked lists each market day, which now are being subscribed to by hundreds of individual investors, mostly repeatedly. The average annual rate of price gain from ALL 1760 completed positions under TERMD disciplines (74% profitably, 26% at a loss) has been +32%, compared to the parallel holding in SPY of +2%. Conclusion The current-day forecast for Friday will have its hypothetical position started with the end of day cost price for SVXY on Monday, following the standard TERMD score-keeping practice. It is entirely possible that any number of world events (including summertime boredom) may cause markets to continue to see price erosion that might cause SVXY prices to revisit the high-60s, low-70s seen in recent weeks. Should that happen, SVXY will likely become even more attractive and continue to compete effectively with other equity investment candidates. That argues for scaling into an SVXY position in measured bites rather than by one major commitment. But the present conditions have attraction that should not be ignored. For most individual investors the task of deciding on where to put capital at risk is a bewildering assignment. The choice by so many of turning such decisions over to others has often resulted in expected progress not yet being achieved, while many years of time that cannot be recovered has been expended. Having poor experience in relying on others, it is understandable to question just a different version of the same, particularly where terms like odds, payoffs, and drawdowns are involved that are not familiar. But for the investor in need, it quickly becomes apparent that time to devote to this second job (full-time if done thoroughly and adequately) is really beyond reach for most of us. A saving grace of the approach we advocate is that you are looking out, actively, for your own affairs, based on the extensive, but condensed, understanding of probable future prospects made by as genuine experts as can be found, in the process of looking out for their own best interests. Their appraisals of alternative choices are presented in sufficient detail of contrasting risk and reward dimensions to enable you to fit them into your own preferences. There is no guarantee that market outcomes of the past based on forecasts similar to ones being made currently will be repeated, but you have the choice of seeking historical precedents sufficient to your standards for the history to become a reassurance to you. It’s your investment capital at risk, you have the responsibility (and the privilege) of deciding how it should be applied. Where we can be of help we will do what we can. Disclosure: I/we have no positions in any stocks mentioned, and no plans to initiate any positions within the next 72 hours. (More…) I wrote this article myself, and it expresses my own opinions. I am not receiving compensation for it (other than from Seeking Alpha). I have no business relationship with any company whose stock is mentioned in this article.