Tag Archives: seeking-alpha

Don’t Overpay For An Epic Investing ‘Fail’

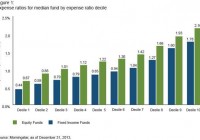
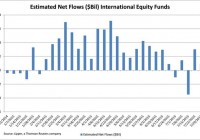
Summary Lowering the cost of actively managed funds is an important step in improving the odds of outperformance. Highly rated funds are not good predictors of future performance. Why a holistic approach with good judgment, including quantitative and qualitative elements is a “WIN!” By Chris Philips, CFA An investing “FAIL”? Pop culture and investing rarely cross paths. After all, pop culture is hip, exciting, and flashy. Conversely, we’ve seen that successful investing is generally anything but. Nevertheless, the last decade or so has seen the rise of an internet meme that may be applicable to the investing world-“FAIL.” So what are a “FAIL” and its illustrious cousin “epic FAIL”? Both are generally used to describe embarrassing events, such as setting your kitchen on fire as you film yourself attempting to light birthday candles (FAIL)-by using a blowtorch to be cool (epic FAIL). Now I hope none of us have burned down a house while reviewing an investment portfolio! So I can’t visualize an investing epic FAIL in this vein (although some may suggest that the global financial crisis would suffice), but there are at least three areas where I can confidently say FAIL: cost, ratings, and performance. The cost-value riddle First up is the issue of cost. People intuitively associate higher cost with value and performance. Unfortunately, it’s backwards. For example, see Figure 1, where I break out U.S. equity and fixed income funds into deciles according to their reported expense ratios. Cost and performance ARE related. However, the data show that the lower the cost, the better the experience (on average). You should pay more for performance? FAIL (click to enlarge) Relying on ratings Next is the question of industry ratings. The allure of something-anything-that could potentially help us do better by our clients is strong. Figure 2 illustrates this -investors have clearly favored higher-rated funds and shunned lower-rated funds. These patterns wouldn’t be noteworthy if 4- and 5-star-rated funds consistently added value. (Or perhaps they would be, if they revealed a metric that could reliably predict performance!) However, in the research underlying Figure 2, we showed that highly rated funds in one rating period tended to be the worst performers relative to a style benchmark over the next 3 years-underperforming on average by 138 basis points per year. Funds with 1-star ratings also underperformed, but at a much more modest rate of 15 basis points per year. You should stick to top-rated funds? FAIL Patience and performance Of course, some may dismiss the cash-flow example as “retail” investors chasing returns. However, there’s also evidence of return-chasing among institutional investors.[1] After all, we are all human, whether acting in a fiduciary capacity or on our own behalf. In an article published in The Journal of Finance , Amit Goyal and Sunil Wahal reported on the outcomes of hire/fire decisions across a broad sample of plan sponsors. They found that underperforming managers were (not surprisingly) replaced with managers who demonstrated significant outperformance (represented with blue bars in Figure 3). I say “not surprisingly,” because what fiduciary would want to keep an underperforming fund or asset on the books? However the twist is in what happened following the replacement. On average, those managers who were hired to replace the poor performers underperformed the same managers they replaced in the next 1-, 2-, and 3-year periods! In Figure 3, this record is shown by the green bars. You should systematically replace underperformers? FAIL Avoiding FAIL The moral of this story is that while ratings and cost should not be summarily dismissed, we should take a collective step back and think about what really matters when constructing portfolios or looking to provide clients with the best opportunity for success. Controlling costs is critical, to be sure. But equally important is a robust evaluation process that includes many variables for considering whether fund A, B, or C should be added, dropped, or ignored. Such a qualitative process can complement the quantitative metrics that have been shown to potentially lead us astray. A holistic approach with good judgment, including quantitative and qualitative elements? Now that’s a WIN! Footnotes Mark Grinblatt, Sheridan Titman, and Russ Wermers initiated the academic literature on return-chasing behavior among institutional investors in their paper “Momentum investment strategies, portfolio performance, and herding: A study of mutual fund behavior,” The American Economic Review , 85(5), 1995. Notes All investing is subject to risk, including the possible loss of the money you invest. Past performance does not guarantee future results.

A Pleasant Surprise Among Emerging Market ETFs

Broadly speaking, these are not the best of times for emerging market exchange traded funds. India large-cap ETFs have been significantly better or less bad than other single-country and diversified emerging markets ETFs over the past month. In the near term, India ETFs could pullback following the Reserve Bank of India’s decision Tuesday to hold interest rates at 7.25 percent. By Todd Shriber, ETF Professor Broadly speaking, these are not the best of times for emerging market exchange traded funds. Things are so bad that 22 emerging markets funds hit 52-week lows on Monday. Since the star of the current quarter, the iShares MSCI Emerging Markets ETF (NYSEARCA: EEM ) has bled nearly $2.5 billion in assets. However, there is some light among the darkness and it comes courtesy of Indian small-caps. India large-cap ETFs have been significantly better or less bad than other single-country and diversified emerging markets ETFs over the past month, but funds such as the Market Vectors India Small-Cap Index ETF (NYSEARCA: SCIF ) , the EGShares India Small Cap ETF (NYSEARCA: SCIN ) and the iShares MSCI India Small Cap Index ETF (BATS: SMIN ) have legitimately impressed . While the MSCI Emerging Markets Index has tumbled 5.6 percent over the past month, the aforementioned trio of India small-cap ETFs posted an average return of almost 5.5 percent. This is not unfamiliar territory for India ETFs, which were the shining stars of the BRIC quartet last when emerging markets equities slumped. In the near term, India ETFs could pullback following the Reserve Bank of India’s decision Tuesday to hold interest rates at 7.25 percent, but the central bank has obliged with three rate cuts earlier this year, at least two of which can be considered surprises. Interestingly, the gains for Indian small-caps over the past month arrived as investors pulled $35 million from Indian stocks last month, still a scant percentage of the $7.1. billion that has flowed into stocks in Asia’s third-largest economy this year, according to Bloomberg . Divergent Returns Significant differences between the India small-cap ETFs tell the story of divergent returns. For example, the Market Vectors India Small-Cap Index ETF features a 21.2 percent to consumer discretionary stocks, leveraging the ETF to India’s burgeoning consumer story. SMIN, the iShares offering, is also a play on India’s resurgent domestic economy with a 44.3 percent allocation to financial services and industrial names. The EGShares India Small Cap ETF devotes over half its weight to financial stocks and industrials. A BlackRock fund manager recently sounded a bullish tone on Indian non-bank financials and select sub-sectors of the industrial space. Though the fund manager did not mention the ETFs highlighted here, institutional support for Indian small-caps should drive the likes of SCIF, SCIN and SMIN higher. Indian small-caps are not a bump-free ride. For example, SCIF has a three-year standard deviation of almost 32 percent, or 2 1/2 times that of the MSCI Emerging Markets Index. However, Indian small-cap, at least as measured by SCIF and SCIN, are not excessively valued. SCIF sports a price-to-earnings ratio of just 11 , while SCIN’s price-to-book ratio is just 1.16. Disclaimer: Neither Benzinga nor its staff recommend that you buy, sell, or hold any security. We do not offer investment advice, personalized or otherwise. Benzinga recommends that you conduct your own due diligence and consult a certified financial professional for personalized advice about your financial situation. Disclosure: I/we have no positions in any stocks mentioned, and no plans to initiate any positions within the next 72 hours. (More…) I wrote this article myself, and it expresses my own opinions. I am not receiving compensation for it. I have no business relationship with any company whose stock is mentioned in this article.

Mutual Fund Investors Take Wait-And-See Approach Ahead Of FOMC Meeting

By Tom Roseen Despite the flight to safety and what many market pundits might have expected-a subsequent uptick in flows to money market funds, for the second week in three investors were net redeemers of fund assets (including those of conventional funds and exchange-traded funds [ETFs]), withdrawing a net $6.2 billion for the fund-flows week ended, Wednesday, July 29. Investors pulled money out of all four of Lipper’s major macro-groups, redeeming $3.5 billion from taxable bond funds, $1.8 billion from equity funds, $0.9 billion from money market funds, and $73 million from municipal bond funds. Weak earnings reports from bellwether stocks such as American Express (NYSE: AXP ), Caterpillar (NYSE: CAT ), and 3M (NYSE: MMM ), accompanied by a hangover from China’s market meltdown, outweighed a drop in weekly applications for unemployment benefits to the lowest level since 1973. Investors shrugged off a better-than-expected earnings report from Amazon and ignored the Anthem (NYSE: ANTM )-Cigna (NYSE: CI ) M&A news and the announcement that Greek officials had approved a second set of austerity measures. Instead, investors focused on the continued decline in oil, the selloff in commodities, concerns over a decline in global economic growth, and a housing report that showed the largest slowdown in single-family-home sales in seven months. Ho-hum economic data and sketchy guidance from U.S. firms during the flows week initially led investors to safe-haven plays, especially after the Shanghai Composite’s largest one-day slide (-8.5%) since February 2007. Despite a better-than-expected June durable goods report, investors took a wait-and-see approach ahead of the two-day Federal Open Market Committee meeting, leading to a small rally in U.S. Treasuries. However, in the last two days of the flows week U.S. stocks rallied after China stocks showed a more tempered decline and oil prices rose for the first time in five sessions. On Wednesday, July 29, the Dow marked its fifth straight session of triple-digit moves, this time to the upside after the Federal Reserve left itself wiggle room to raise rates as early as September, citing a continuation of solid gains in the job market. Investors cheered Citrix’s better-than-expected earnings report, Chinese stocks moved higher, and crude oil had its second biggest one-day gain for July, with futures rising 1.7% for the day. Nonetheless, the Dow Jones Industrial Daily Reinvested Average still finished the flows week down 0.56%. (click to enlarge) Source: Lipper, a Thomson Reuters company Interestingly, fund investors collectively kept their foot on the gas pedal for a few risk-on plays, injecting net new money into international equity funds (+$0.9 billion), health/biotechnology funds (+$0.6 billion), mid-cap funds (+$0.2 billion), and science & technology funds (+$0.1 billion). Except for small net flows into government/Treasury funds (+$0.4 billion) during the week, the typical safe-haven plays didn’t attract net new money as investors appeared to be waiting on the policy statement by the Fed to plan their next steps. Year to date, international equity funds (including traditional funds and ETFs) have attracted $135.1 billion of net new money, while their domestic equity counterparts have suffered net redemptions to the tune of $54.7 billion.