Tag Archives: seeking-alpha

The Uncertainty Around The Fed’s Liftoff Keeps GLD From Falling

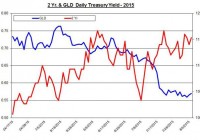
Summary The uncertainty around the possibility of a rate hike in the coming months benefits GLD. Nonetheless, a September rate hike is still on the table. Short-term treasury yields are adjusting for higher rates in the coming years. The non-farm payroll report came a bit short of market estimates with a gain of 215,000 jobs. Nevertheless, the SPDR Gold Trust ETF (NYSEARCA: GLD ) bounced back over the weekend and kept slowly rising at the beginning of the week. GLD could resume its descent, however, if the FOMC were to raise rates next month. But the market is still on the fence about the timing of the historic lift off. So September is still on the table? The market still seems confused about the Fed’s timing of the first rate decision. And the mixed signals we have received in recent weeks – from FOMC participating members such as James Bullard and Dennis Lockhart , who keep suggesting that a lift off is imminent, through the economic data, which for the most part, keep showing the U.S. economy is growing but not much faster than earlier this year, and the previous FOMC meeting , which had a dovish sentiment – haven’t made things any easier for the market’s estimates. Case in point, the implied probabilities for a September rate hike, which were nullified a few days ago, have gone back up to 54%. For December, the odds are 75%. Nonetheless, any delay in the first rate hike is likely to keep GLD from falling to a new low. Short-term rates are picking up Besides the implied probabilities derived from the bond market, the rates of short- and long-term rates also provide an interesting account of the changes in the demand for treasury bills. Specifically, the long-term yields (say for 10 years and higher) have actually come down in the past few weeks while short-term rates for 6 months to 3 years have risen. It seems that even though the market is slowly adjusting to the fact that low cash rates aren’t here to stay, the long-term rates, which are mostly driven by, besides the Fed’s short-term rates, inflation expectations and risks haven’t gone up. (click to enlarge) Source: U.S. Department of Treasury and Bloomberg This could be because the market considers lower inflation in the long run than it did in the past or that the risk in investing in U.S. treasury bills could rise while over the short run, the rise in yields is mostly related to cash rate hikes. When it comes to inflation expectations, they have gone up in the past few months, as you can see in the chart below: (click to enlarge) Source: Federal Reserve Bank of Cleveland Nonetheless, the 5-year and 10-year expectations are still below the Federal Reserve’s inflation target of 2%. Even Federal Reserve Vice Chairman Stanley Fischer recently pointed out that the current U.S. inflation is very low, mainly due to low commodities prices and that global deflationary trend “bothers” the Fed, even though it’s only one among several factors that impact the FOMC’s decisions about policy. Conversely, Lockhart suggested in a recent press conference that the first rate hike won’t depend on U.S. inflation – so even if inflation doesn’t reach the 2% mark anytime soon, which is a very fair assessment, liftoff is still a viable possibility next month. And who said there isn’t confusion in the markets about the Fed’s policy? For GLD, lower long-term yields could actually benefit its price, as it did in the past when yields plummeted to historic low levels. But this hasn’t been the case. Even though for gold, long-term yields are more likely to impact the direction of gold prices, the recent rally of short-term yields may have also contributed to the weakness in the gold market. (click to enlarge) Source: U.S. Department of Treasury and Bloomberg Moreover, the correlations among GLD and the U.S. treasury yields aren’t too strong with the strongest correlations for the short-term yields – 2-year bonds. In the past, the long-term treasury yields had a much stronger and significant correlation with GLD. Thus, the uncertainty around the Fed’s policy over the short term is a strong factor in moving both short-term yields and GLD. The JOLTS report will be released this week and will provide another indicator about the U.S. labor market – last month’s report showed a modest fall to 5.36 million job openings. Next week, the FOMC will release the minutes of the July meeting, which could provide a bit more guidance about the last rate decision and what’s up ahead especially considering it’s the last piece of information from the FOMC before the September meeting. The labor market showed another solid growth in jobs but didn’t beat expectations. The FOMC keeps the rate hike decision uncertain, which for now actually benefits GLD. As long as there remains a possibility of a rate hike later rather than sooner, GLD could, at best, slowly rise and at worse remain range bound. But as the U.S. labor continues to improve, the odds of a rate hike in September will rise – a scenario that could bring back down GLD. For more please see: ” Gold and Inflation – Is there a relation? ” Disclosure: I/we have no positions in any stocks mentioned, and no plans to initiate any positions within the next 72 hours. (More…) I wrote this article myself, and it expresses my own opinions. I am not receiving compensation for it (other than from Seeking Alpha). I have no business relationship with any company whose stock is mentioned in this article.

Today’s Best-Bet Wealth-Builder ETF Investment

Summary From a population of some 350 actively-traded, substantial, and growing ETFs this is a currently attractive addition to a portfolio whose principal objective is wealth accumulation by active investing. We daily evaluate future near-term price gain prospects for quality, market-seasoned ETFs, based on the expectations of market-makers [MMs], drawing on their insights from client order-flows. The analysis of our subject ETF’s price prospects is reinforced by parallel MM forecasts for each of the ETF’s ten largest holdings. Qualitative appraisals of the forecasts are derived from how well the MMs have foreseen subsequent price behaviors following prior forecasts similar to today’s. Size of prospective gains, odds of winning transactions, worst-case price drawdowns, and marketability measures are all taken into account. Today’s most attractive ETF Is the ProShares UltraPro Russell2000 ETF (NYSEARCA: URTY ). The investment seeks daily investment results that correspond to three times (3x) the daily performance of the Russell 2000® Index. The fund invests in securities and derivatives that ProShare Advisors believes, in combination, should have similar daily return characteristics as three times (3x) the daily return of the index. The index is a float-adjusted, market capitalization-weighted index containing approximately 2000 of the smallest companies in the Russell 3000® Index or approximately 8% of the total market capitalization of the Russell 3000® Index, which in turn represents approximately 98% of the investable U.S. equity market. It is non-diversified. The fund currently holds assets of $79.94 million and has had a YTD price return of +6.57%. Its average daily trading volume of 140,328 produces a complete asset turnover calculation in 5.9 days at its current price of $95.76. Behavioral analysis of market-maker hedging actions while providing market liquidity for volume block trades in the ETF by interested major investment funds has produced the recent past (6 month) daily history of implied price range forecasts pictured in Figure 1. Figure 1 (used with permission) The vertical lines of Figure 1 are a visual history of forward-looking expectations of coming prices for the subject ETF. They are NOT a backward-in-time look at actual daily price ranges, but the heavy dot in each range is the ending market quote of the day the forecast was made. What is important in the picture is the balance of upside prospects in comparison to downside concerns. That ratio is expressed in the Range Index [RI], whose number tells what percentage of the whole forecast range lies below the then current price. Today’s Range Index is used to evaluate how well prior forecasts of similar RIs for this ETF have previously worked out. The size of that historic sample is given near the right-hand end of the data line below the picture. The small blue thumbnail distribution at the bottom of Figure 1 indicates the current RI’s size in relation to all available RIs of the past 5 years. The first items in the data line are current information: The current high and low of the forecast range, and the percent change from the market quote to the top of the range, as a sell target. The Range Index is of the current forecast. Other items of data are all derived from the history of prior forecasts. They stem from applying a T ime- E fficient R isk M anagement D iscipline to hypothetical holdings initiated by the MM forecasts. That discipline requires a next-day closing price cost position be held no longer than 63 market days (3 months) unless first encountered by a market close equal to or above the sell target. The net payoffs are the cumulative average simple percent gains of all such forecast positions, including losses. Days held are average market rather than calendar days held in the sample positions. Drawdown exposure indicates the typical worst-case price experience during those holding periods. Win odds tells what percentage proportion of the sample recovered from the drawdowns to produce a gain. The cred(ibility) ratio compares the sell target prospect with the historic net payoff experiences. Figure 2 provides a longer-time perspective by drawing a once-a week look from the Figure 1 source forecasts, back over two years. Figure 2 (used with permission) What does this ETF hold, causing such price expectations? Figure 3 is a table of securities held by the subject ETF, indicating its concentration in the top ten largest holdings, and their percentage of the ETF’s total value. Figure 3 source: Yahoo Finance URTY holdings reveal how an average of assets in each of its top ten commitments, all swap contracts in either the Russell 2000 index or the ETF tracking that index, iShares Russell 2000 (NYSEARCA: IWM ) provide a 3x leverage to the price movements of that small-cap index. Please note that the top ten swap contracts equal 278% of the ETF’s total assets. To have an idea of the composition of the Russell 2000 index, Figure 4 is a table of data lines similar to that contained in Figure 3, for each of the top ten holdings of the ETF tracking the Russell 2000 index, IWM. Figure 4 source: Yahoo Finance Now note that the Russell 2000 index does indeed contain 2,000 securities of small-capitalization companies, many of which are in quite volatile circumstances. The IWM’s top ten holdings (by size of holding) quite probably are intended to be the better-performing issues. While these ten represent only 2 ½% of the fund’s total assets, they are five times the size of ten average pieces of 2,000 securities at 0.05% of the total. The IWM’s top ten holdings provide only a peek at the kinds of companies contained in the Russell 2000 index, but it is better than nothing (or of everything). In order to fill out some sense of these emphasized holdings of the fund and the index, Figure 5 gives the details of MM price range hedging-derived forecasts for each of the ten, and compares them with data from our ranked top20 securities list for the same day. Figure 5 (click to enlarge) In an index as unpredictably dynamic as this, wide variations in market experience seem to be the rule. Column (5) contains the upside price change forecasts between current market prices and the upper limit of prices regarded by MMs as being worth paying for price change protection. The average of +12.7% of the top ten IWM/index holdings is close to our list’s population average of all 2500+ equities MM forecasts of +13.1%. It is about 2 ½ times the upside forecast for SPY price change prospects. The other side of the coin is column (6), which shows what actual worst-case price drawdowns typically have been in the 3 months following each time there has been a forecast like those of the present day. Those risk exposures have averaged -6.3% in the holdings top ten, better than -8.6% experienced by list equities at large, but larger than the only -3.3% on the SPY ETF. These holdings have attractive reward tradeoffs between returns and risks, with the top ten (column 14) at a ratio of 2.0, compared to equities overall at 1.5 times. This is better than the market average of SPY at a ratio of 1.7 times risk avoidance, which has a cost of an anticipated reward (column 5) only half that of the ten best index stocks. Another qualitative consideration is the credibility of the ten IWM/index big holdings after previous forecasts like today’s. The net average price change (column 13) of the ten has been 0.8 times the size of the (column 5) upside forecast average, +10.6% (column 9) compared to +12.7%. The equity population’s actual price gain achievement, net of losses has been a pitiful +3.7% compared to promises of 13.1%. The ability of IWM/index holdings to recover from those worst-case drawdowns and achieve profits occurred in 83% of experiences (column 8). The equity population only recovered less than two thirds of the time, and while the SPY experiences were about the same as the ten IWM/index holdings, the achieved gains were much smaller. SPY has had only +3.4% gains previously from like forecasts of +5.7%. In many respects the IWM/index holdings are quite similar to the average of our daily best20 list. That should be no surprise, since URTY is one of those 20 best ranked issues on this day. Conclusion URTY provides attractive forecast price gains, supported by its equally appealing largest holdings. Both the ETF and many of its major holdings offer very attractive prospects in near-term price behaviors, demonstrated by previous experiences following prior similar forecasts by market makers. The diversity of its holdings is very broad, providing a wide opportunity to share in constantly developing discoveries across the biotechnology as well as software applications and other high-technology fields. URTY’s price now, in comparison to the forecast price expectations of market professionals, appears to be quite attractive. Disclosure: I/we have no positions in any stocks mentioned, and no plans to initiate any positions within the next 72 hours. (More…) I wrote this article myself, and it expresses my own opinions. I am not receiving compensation for it (other than from Seeking Alpha). I have no business relationship with any company whose stock is mentioned in this article.

UIL’s Updated Connecticut Merger Filing

In late June the Public Utility Regulatory Authority of Connecticut issued a draft decision denying UIL’s merger with Iberdrola USA. UIL withdrew their application and filed a new application on July 31. The new application substantially addresses PURA’s concerns and increases the likelihood that this value creating merger will be approved. UIL Holdings (NYSE: UIL ) and Iberdrola USA ( IUSA ) (a subsidiary of Spanish utility Iberdrola (OTCPK: IBDSF )) are making their second attempt to get their merger through the notoriously difficult Connecticut Public Utility Regulatory Authority ( OTCPK:PURA ). As discussed in my earlier post , this is a merger that will create substantial value for the participants, so there was no way they would give up easily after PURA’s initial rejection. The new filing really lays out the benefits for the state of Connecticut, and should be enough to get the deal approved in that jurisdiction. PURA’s issues with the original application are summarized in this excerpt from the draft decision : The Applicants have not provided any measurable or quantifiable commitments that unequivocally assure the Authority that the public interest of the ratepayers will not be harmed. In response, the applicants have increased a number of the benefits Connecticut customers will receive, and presented them in a quantifiable way that easily allows PURA to see the advantages for customers. The draft decision also listed a number of items that had been included in recent Connecticut merger agreements. Many of the updates to the application are related to this list. A discussion of these items follows. Rate credit allocated to retail customer classes UIL and IUSA have increased the rate credits for customers from about $5M in the original application, to approximately $20M in the new one. The applicants have actually proposed three different methods to distribute the credit to customers. The first option would apply a $20M credit customers in the first year after the closing. Another proposal is for UIL to provide $26M of credits spread over ten years. The last option is essentially giving a $1.5M annual credit over thirty years. The present value of all three options is essentially the same, and the applicants are giving PURA a choice based on feedback they received from their earlier application. Commitment to accelerate the pole inspection cycle. This is basically a reliability commitment. For those unfamiliar with the issue, utility poles, like any other piece of the electric system, can wear out as they age. The end of a pole’s life can lead to a power outage or damage to property. Increasing the frequency of these inspections can reduce the number of surprise failures, resulting in fewer outages. Subsidiary United Illuminating (UI) is the custodian of 87,000 poles. In 2005 they pledged to improve their pole inspection process, and they have $700,000 budgeted for pole inspections in 2015. With an already strong commitment to inspecting utility poles, no further enhancements were made in this application. However, while UI will not address poles, they are making some quantifiable reliability commitments. In the first application UIL had only said there would be benefits from sharing best practices and better storm response, and that there would be no deterioration in service after the transaction. Now the applicants have pledged to increase investment in electric distribution system resiliency with a reduced recovery of the first $50M of this spending over a two year period. They are also making some reliability commitments at their Southern Connecticut Gas (SCG) subsidiary. UIL is promising to double the annual spending on the replacement of cast iron/bare steel pipe (from $11M to $22M per year) over the next three years without seeking recovery until the next SCG rate case. There are substantial reliability issues with these older pipes, and increasing the rate of replacement should have an impact on safety and dependability. UIL estimates the gas commitment will create a $1.6M benefit, and the commitment at UI will create a $5M benefit. Commitment to improve non-storm and storm related service quality performance at a minimum of the 10-year historical average UIL stated that they would improve a number of different service metrics by 5% by the end of the third year after the closing of the deal. These metrics were: average answering times, % abandoned calls, % appointments met. UIL also promised to maintain the high level of reliability at UI as measured by SAIDI and SAIFI. (SAIDI is the System Average Interruption Duration Index, essentially the average number of minutes a customer is out during a year; and SAIFI is the System Average Interruption Frequency Index, essentially the average number of times a customer has an outage in a year.) You can see how well they have been doing on these metrics by looking at this information from UIL’s 2015 Reliability Report . SAIFI SAIDI 2010 0.65 85 2011 0.81 102 2012 0.60 58 2013 0.58 51 Four-Year Average (’10 – ’13) 0.66 74 2014 0.56 53 2014’s SAIFI number was actually the company’s best in the past eighteen years. The 2014 SAIDI number was better than all but two of the previous eighteen years. Also, UI’s SAIDI and SAIFI numbers are better than neighboring utility CL&P. In 2014 CL&P’s SAIDI was 88.9 minutes, and their SAIFI was 0.77. It seems that UI maintaining current reliability numbers should be acceptable to PURA. Commitment to open space land UIL has not specifically addressed open space land, but they appear to be working on an issue that is related in spirit. This is regarding English Station, a retired power plant on a nine acre site that UIL sold over fifteen years ago. This property has substantial environmental issues, and there is a big dispute over who should pay the cleanup costs. The applicants have stated that if the merger is approved they will end the legal wrangling, and agree to pay for the cleanup of the site. This cost is currently estimated at $30M. (More information on the English Station dispute can be found here .) Seven year commitment to not move headquarters out of Connecticut The applicants have proposed to create a new management position entitled the President of Connecticut Operations. The President of Connecticut Operations will be headquartered in Connecticut, and the applicants state that the headquarters will remain in Connecticut for at least seven years. (I’m pretty sure we know where they came up with that length of time.) One issue that was not in PURA’s bullet list, because this is the first time it has come up in a Connecticut utility merger case, is ring-fencing. UIL has dramatically increased the robustness of their proposed ring-fencing provisions. The applicants have proposed creating a special purpose entity (SPE) adding another layer of separation between UIL and IUSA. 100% of UIL will be owned by the SPE, and IUSA will own the SPE. The SPE will have at least one independent director, and a “Golden Share” provision. This Golden Share has a non-economic interest in the SPE and will be owned by an administration company in the business of protecting special purpose entities. The Golden Share has the right to vote on certain matters, primarily with respect to the filing of bankruptcy. (More information can be found in Attachment 2 of the merger application.) UIL and IUSA have made a dramatic improvement in their merger application. The benefits Connecticut customers will receive have been increased and quantified, so it is easier to see the advantages of the deal for the state’s citizens. The applicants have specifically addressed many of the items PURA brought up in their earlier draft decision. In particular they have substantially beefed up the ring-fencing provisions, so a problem elsewhere in Iberdrola’s operations does not hurt any of UIL’s subsidiaries. Based on these changes it seems like the merger should have a very good chance of getting PURA approval. Editor’s Note: This article discusses one or more securities that do not trade on a major U.S. exchange. Please be aware of the risks associated with these stocks. Disclosure: I/we have no positions in any stocks mentioned, and no plans to initiate any positions within the next 72 hours. (More…) I wrote this article myself, and it expresses my own opinions. I am not receiving compensation for it (other than from Seeking Alpha). I have no business relationship with any company whose stock is mentioned in this article.