Last Week’s Best Performer- Acadia Healthcare Company
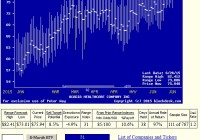
Summary One of 20 ranked (#11th) as best-odds for wealth-building from coming-price forecasts implied by market-maker [MM] hedging on 6/17/2015. Its target upside price of 78.38 was reached (within ½%) on 6/22/2015’s close at $77.99 after a day’s high of $78.50. ACHC’s +7.7% gain in only 5 calendar days produced a huge annual rate, but was only one of 27 hypothetical positions closed on that strong market-performance day. Their average gain of +9¼% in average holding periods of 33 days from prior lists of top20 MM forecasts resulted in gains at an average annual rate of +166%. Let’s look at what specific circumstances created this bonanza. How to build wealth by active investing Passive investing doesn’t do it nearly as well. SPY is now up in price YTD 2015 at an annual rate of 4.5%. Market-Maker [MM]-guided active investing this year, has identified 1281 such closed-out positions as ACHC, 20 a day. They earned at a +31.4% rate. That’s some 2700 basis points of “alpha” better than SPY. Our “leverage” is not financial. Those results are all from straight “long” positions in stocks or ETFs, no options, futures, or margin. We have the “leverage” of perspective. The perspective of market professionals who know, minute by minute, what their big-money “institutional” portfolio manager clients are trying to buy, and to sell, in the kind of volume that can’t be done with ordinary trades. Not only which securities, but at what prices. And on which side of each block trade their firm is being called on to put the firm’s capital at risk to bring the transaction to balance. We get that perspective by knowing what is meant by the way the MMs protect themselves when they hedge their capital exposures. Their actions tell just how far the market pros think prices are likely to get pushed, both up and down. That perspective is an important leverage, but it is magnified by the way we use perspective on the other key investing resource that is required: TIME. Here is what makes active investing active. We not only buy, we sell. We sell according to plan. The plan is set at the time we buy. An explicit price target is set then, with a time limit to our patience for it to be accomplished. We are investing time alongside of our capital. If the sell target price is not reached by when the time limit arrives, the position is sold, gain or loss on the capital is taken, and both capital and time are ready, positioned for immediate reinvestment. Active investing keeps its capital working all the time, it does not try to time the overall market, nor does it make uncompetitive investments in the market, ones which would accept single-digit rates of return in fear of seeing a loss or having to accept one in order to keep capital and time working diligently. Perspective and time-discipline can keep the odds of having winning holdings positions in favor of active investors. Three wins for every loss is quite doable, and the ratio even reaches seven out of every eight. Here are the specifics of how it worked for ACHC Figure 1 pictures how the market-making community has been viewing the price prospects for Acadia Healthcare Company, Inc.(NASDAQ: ACHC ) over the past six months. Figure 1 (used with permission) The vertical lines of Figure 1 are a visual history of forward-looking expectations of coming prices for the subject stock. They are NOT a backward-in-time look at actual daily price ranges, but the heavy dot in each range is the ending market quote of the day the forecast was made. What is important in the picture is the balance of upside prospects in comparison to downside concerns. That ratio is expressed in the Range Index [RI], whose number tells what percentage of the whole range lies below the then current price. A low RI means a large upside. Today’s Range Index is used to evaluate how well prior forecasts of similar RIs for this stock have previously worked out. The size of that historic sample is given near the right-hand end of the data line below the picture. The current RI’s size in relation to all available RIs of the past 5 years is indicated in the small blue thumbnail distribution at the bottom of Figure 1. The first items in the data line are current information: The current high and low of the forecast range, and the percent change from the market quote to the top of the range, as a sell target. The Range Index is of the current forecast. Other items of data are all derived from the history of prior forecasts. They stem from applying a T ime- E fficient R isk M anagement D iscipline to hypothetical holdings initiated by the MM forecasts. That discipline requires a next-day closing price cost position be held no longer than 63 market days (3 months) unless first encountered by a market close equal to or above the sell target. The net payoffs are the cumulative average simple percent gains of all such forecast positions, including losses. Days held are average market rather than calendar days held in the sample positions. Drawdown exposure indicates the typical worst-case price experience during those holding periods. Win odds tells what percentage proportion of the sample recovered from the drawdowns to produce a gain. The cred(ibility) ratio compares the sell target prospect with the historic net payoff experiences. Figure 2 provides a longer-time perspective by drawing a once-a week look from the Figure 1 source forecasts, back over two years. Figure 2 The success of a favorable outlook comparison for ACHC on June 17 was not any rare magic of the moment. It just happened that enough reinforcing circumstances came together on that day to make the forecast and its historical precedents look better than hundreds of other investment candidate competitors. Those dimensions are highlighted in the row of data items below the principal picture of Figure 1. The balance of upside to downside price change prospects in the forecast sets the stage of similar prior forecasts. They were followed by subsequent favorable market price changes that turned out on that day to be competitive in the top20 ranking of over 2500 equity issues, both stocks and ETFs. On other days luck would have it that several additional stocks were included in the daily top20 lists, and then on June 22nd would reach their sell target objectives. Figure 3 puts the same qualifying dimensions as ACHC in Figure 1 together for the days their forecasts were prescient. Then Figure 4 lists them with their closeout results. Figure 3 (click to enlarge) Figure 4 (click to enlarge) Columns (1) to (5) in Figure 4 are the same as in Figure 3. Columns (6) to (11) show the end of day [e.o.d.] cost prices of the day after the forecast, e.o.d.prices on June 22nd, the resulting gains, calendar days the positions were held from the forecast date, and the annual rates of gain achieved. Several things are to be noted. A number of the positions are repeat forecast days for the same stock. This does not make them any less valid, since investors are posed with the recurring task of finding a “best choice” for the employment of liberated or liquidated capital “today” and these issues persisted in being valid competitors for that honor for a number of days. Note that they are not always sequential days. Further, the TERMD portfolio management discipline uses next-day prices as entry costs for each position. Here for Healthsouth Corporation (NYSE: HLS ) the price rose about +10% from $43.29 to $47.41 on the day. It was still included in the scorecard, although a rational investor judgment call might have eliminated it from the choices. As a result, its target-price closeout on the 22nd resulted in a diminished 0.4% gain and a +14% AROR. Also you may note that some of the closeout prices are slightly less than their targets. This is to recognize that investors often become concerned that positions getting close to their targets sometimes back away, losing a gain opportunity and the related time investment. So our sell rule is to take any gain that gets within ½% of the target price. But all exit prices are as e.o.d., so some are above the sell targets, like the 5/21/2015 Aetna (NYSE: AET ) position at $128 instead of $125+. Conclusion These 27 ranked position offerings are an illustration of how active investing takes advantage of the sometimes erratic movements of market prices. It is in the nature of equity markets that investors sometimes get overly depressed and overly enthusiastic. By being prepared for opportunities when they are presented, the active investor often can pick up transient gains that subsequently disappear. This set of stocks is not abnormal in the size of its price moves. They averaged +9.3% gains, and the 2015 YTD average target closeout gains are running +10%. What is unusual in this set is that their time investment has been brief, only 33 calendar days on average, producing an AROR for the set of +165%. Part of the explanation lies in these 27 positions all being successful in reaching their targets. The 2015 YTD target-reaching average (952 of them) took only 46 days to make +10% gains, for an AROR of 113%. The overall YTD average in 2015 is 57 days, including positions closed out by the time limit discipline, making the AROR a more reasonable +31%. But that is well ahead of a passive buy & hold rate of gain in SPY of +4.5%. The man said “It ain’t braggin’ if ya can do it.” We are doing it, have done it before, and have been goaded into this display by passive investment advocate SA contributors whose statements infer that active investors invariably lose money. That’s just not so. We are not in an investment beauty contest with those whose capital resources are extensive enough to allow them to live comfortably off the kinds of placid returns that passive investing typically provide. They are to be congratulated. Our aim is to let investors who are facing financial objective time deadlines that cannot be met by “conventional conservative investing practices” know that there are alternatives that are far more productive and far more risk-limited than they have been led to believe. Alternatives numerous and consistent through time which we intend to continue to record and display. Disclosure: I/we have no positions in any stocks mentioned, and no plans to initiate any positions within the next 72 hours. (More…) I wrote this article myself, and it expresses my own opinions. I am not receiving compensation for it (other than from Seeking Alpha). I have no business relationship with any company whose stock is mentioned in this article.