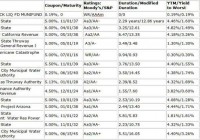
Summary This is the largest muni ETF in the marketplace with a tremendous amount of institutional assets. Will they stay put with rising rates? What is the exposure for the long end of the yield curve and various states? We answer these questions and provide our recommendation on whether it is worth the risk. The iShares National AMT-Free Muni Bond ETF, MUB , is the largest muni ETF in the marketplace. Since the beginning of the year over $700 million in new assets have been added. With all of the bonds rated investment grade or equivalent, we decided to analyze this ETF to determine if it would be a safe haven, if and when interest rates move higher. We also wanted to determine what exposure there is to recent public pension problems in states such as Illinois and New Jersey. With 2,748 holdings this ETF is a comprehensive ETF. According to the fund’s sponsor BlackRock (NYSE: BLK ): The iShares National AMT-Free Muni ETF seeks to track the investment results of an index composed of investment-grade U.S. bonds. The index Blackrock is referring to is the S&P National AMT-Free Municipal Bond Index or {SPMUNUST}. Currently the index has 10,310 issues versus the 2,748 in the ETF, as mentioned above. U.S. territories, including Puerto Rico are excluded from the index. The index is rebalanced monthly and the fund is rebalanced on a monthly basis as well. With such a large quantity difference between the index and ETF the indexing strategy of “Representative sampling” is the most appropriate here. According to the prospectus, this involves simply investing in a representative sample of securities that collectively has an investment profile similar to that of the underlying index. According to S&P, the overall index is designed to track the larger more liquid bonds in the marketplace. Investment grade general obligation, (GO) and essential purpose revenue bonds are included, while high yield bonds are excluded. In terms of a breakdown of the credit quality of the ETF it is not as simple as our past analysis. In most of our previous analysis we would go over each and every issue in an ETF and break down the credit quality and weight the ratings for both S&P and Moody’s. Unfortunately, with over 2,700 issues we decided to defer to the sponsor. iShares by Blackrock uses ratings from S&P, Moody’s and Fitch and converts them to the equivalent S&P major rating category. MUB Credit Quality S&P Ratings&Equivalent Weight Cash and/or Derivatives 0.33% AAA Rated 21.47% AA Rated 56.86% A Rated 20.05% BBB Rated 1.29% According to Morningstar , they cite a .04% in BB rated debt as of June 30, while Fidelity cites .02% in high yield, as of July 20. We attribute these small figures in the below investment grade category to a few recent downgraded and split credit ratings. As such, we can categorically state that the underlying holdings are higher investment grade issues and as noted, almost 25% are AAA rated. Our first point of analysis was the sectors of the ETF. We needed to examine which sectors of the ETF represent exposure in the marketplace. We were expecting only a small divergence between informational sources. What we found was a little confusing. iShares breakdown is quite broad based, while Morningstar is narrower in scope. We elected to use Morningstar’s sector weightings. Sectors of MUB holdings Sector Weight State and Local General Obligation (GO) 31.81% Transportation 23.31% Education 13.39% Water & Sewer 10.68% Advance Refunded or Escrow 8.67% Utilities 5.32% Industrial 1.65% Health 0.06% Housing 0.05% While Morningstar’s breakdown seems thorough it is confusing when compared to iShares. iShares uses: State Tax-Backed: 39.49%, Utility (which makes sense in aggregate with water & sewer): 16.56%, Transportation: 14.82%, Local Tax-Backed: 10.91%, Pre-refunded/Escrow (almost in agreement):8.96%, School Districts: 5.26%, Education: 3.11% and Other Utilities: .52%. As such, in any event the sector risks here are limited to only industrial and health. The primary reasons are the GO’s are backed by the full faith and credit (i.e. taxes), while the “WET” (water, electricity and transportation) are backed by fees and are unlikely to be terminated at any cost. The not so recent Detroit Ch. 9 bankruptcy is a key example of this facet of “WET” issues. The municipality continued to provide these essential services after filing for Chapter 9. The advanced refunded or escrow bonds at 8.67% are AAA and backed by US treasuries (actually, what are termed “slugs”) and are not an issue whatsoever. In terms of the maturity breakdown there is a divergence again in information from iShares and other providers. In this case, we strictly use iShares information. The main reasons is that iShares uses a “Weighted Average Life” or WAL to determine their average length of time to repayment of principal for the securities in the ETF. They use this metric due to the fact that many, if not all, of the high coupon bonds in the ETF will be called. The other information providers do not consider it. MUB Maturity breakdown (WAL) Maturity Weight Cash and/or Derivatives 0.64 0-3 years 19.40 3-6 years 12.71 6-8 years 7.18 8-10 years 5.96 10-12 years 5.98 12-15 years 7.83 15-20 years 13.24 20-25 years 14.04 25+ years 13.03 Morningstar states the maturities using actual dates with a different scale as well. As such an actual comparison is difficult on almost all categories. For information here are Morningstar’s maturity breakdown: 1-3 years: 8.71%, 3-5 years: 8.69%, 5-7 years: 8.67%, 7-10 years: 10.84%, 10-15 years: 16.45%, 15-20 years: 16.21%, 20-30 years: 26.71%, and over 30 years: 3.71%. Fidelity’s maturity breakdown is far simpler: Short Term: 12.65%, Intermediate Term: 26.90%, and Long Term: 60.17%. We interpret the WAL structure from iShares as what is termed a “barbell approach” with heavy weighting on the short end, in terms of callable and pre-refunded issues and a good sized weighting on the long end to take advantage of the higher coupons in term bonds. A key determinant here is of course, not just maturity but duration. We will examine this shortly after reviewing the top 15 issues and their geographic locations. For information purposes here are the top 15 issues with description, coupon and maturity, ratings (Moody’s and S&P), duration, modified duration and yield to the worst and the underlying weight in the ETF: MUB top 15 holdings Unlike many other ETFs, (in terms of its top 15 weightings) the top 15 holdings represent only 3.986% and the balance of 2,736 holdings and negative (settlement) cash balance represents 96.034%. No holdings here represent even .50%, excluding the AAA rated muni money market fund sponsored by Blackrock. As such, we can categorically state this ETF is as close to a full spectrum of diverse issues. In terms of exposure in terms of maturity or duration, it is clear that if rates do go higher the value of the bonds will fall as their modified duration indicates a significant move from the current duration. In terms of a basic understanding, for those investors new to the concept of duration, from Investopedia: Modified duration is the approximate percentage change in a bond’s price for a 100 basis points change in yield, assuming that the bond’s expected cash flow does not change when the yield changes. As such, there is obviously exposure on the long end in this ETF, if and when rates rise. What this simply means is the bonds in the ETF will not be called if rates rise, the cash flow will stay the same and the value of the debt and underlying ETF will fall in price, accordingly. There is a way to determine weightings on a more in depth analytical level and this would be to examine the ETF on the state level. In terms of state geographic breakdown, the weightings are informative. Here are the top 15 states by weightings: MUB Geography top 15 States State Weight California 23.04% New York 19.17% Texas 9.27% Massachusetts 4.99% New Jersey 4.51% Illinois 3.97% Florida 3.42% Pennsylvania 3.24% Washington 3.24% Georgia 2.50% Maryland 2.38% Arizona 1.67% North Carolina 1.46% District of Columbia 1.24% Connecticut 1.19% Our top three geographic holdings of California, New York and Texas make up 51.48% of the ETF. We expected the high tax states of California and New York to be represented but am a little surprised at the 9.30% weighting of the low,(or zero income) tax state Texas. We expected a higher weighting from Massachusetts and New Jersey. Investors concerned about the fiscal condition of Puerto Rico and its credit exposure will have no issues with this ETF. There are no Puerto Rico issues in this ETF as U.S. territories are excluded from the underlying index. Fees, Performance and Recommendation With an inception date 09/07/2007, the fund has an established track record that has encouraged institutional ownership. Unlike other fund sponsors, we were actually able to obtain detailed information on the underlying index as well. Many readers have appreciated the table format, and we have decided to provide one for this section. The index ticker of the S&P National AMT-Free Municipal Bond Index is {SPMUNUST}. Category {MUB} {SPMUNUST} Net Expense Ratio .25% – Weighted Average Yield to Maturity 1.98% – Weighted Average Maturity 5.49 years 13.53 years 12-Month Yield 2.63% 2.98% SEC 30-Day Yield 1.81% NA Distribution Yield 2.63% 3.07% (YTM) Weighted Average Coupon 4.69% 4.61% Effective Duration/Modified Duration 4.71 years/NA N/A/4.69 years 12-Month Total Return 2.26% 2.98% YTD Total Return .23% .60% Shares Beta/Holdings Beta -0.11/NA NA Annual Portfolio Turnover 5.00% NA Reviewing each of the categories beginning with the Net Expense Ratio of .25%, shows little surprises. The asset class median is .30%. In terms of the yields, they are quite attractive with a reasonably short duration attributed to the call schedule of the issues in the ETF. This is in spite of a weighted average maturity of 13.53 years on the index. The ETF has almost 60% less in terms of the index weighted average due to calls and pre-refunded issues. This attribute lowers the weighted average significantly. In terms of returns the 12 month yield has been consistent and iShares states a tax equivalent distribution yield of 4.65% which is considered quite attractive for high rated municipal bonds. The Year to date return is quite low. This is attributed to the intermittent sell offs in the overall bond market and concerns about rising rates in fixed income markets. There have also been concerns about pension exposure in various states. A few states in the past, such as Kansas in 2014, were charged by the SEC for securities fraud regarding their pension liabilities. While Schwab has warned of possible defaults, downgrades are still possible but mostly in local municipal issues and cities, i.e. Chicago. The exposure to downgrades in the issues in this ETF would be light at best. In any event, with the holdings extremely broad based with state diversification we do not consider this a concern for this particular ETF. The share turnover of 5% is quite low compared with the asset class median of 25%, and the Beta of the shares indicates an extremely low risk investment as compared to equities and almost close to the beta of T-bills (0). The ETF has been and continues to be a stable “cash cow” vehicle for many funds with an increase of 12.83% in the current quarter alone. Some of the largest institutional owners include PNC Financial Services (NYSE: PNC ) (with 7.37% ownership), Bank of America (NYSE: BAC ), UBS Group AG (NYSE: UBS ), and Morgan Stanley (NYSE: MS ). Though, mutual funds have been net sellers for the past few quarters we attribute this to investor concerns over rising rates and further changes to asset allocation models. In any event, overall net flows for the month of June indicate an increase of $108.46M. With a 52-week high of $112.20 and a 52-week low of $107.58, the shares closed at $109.07 -.10 on July 28. Our Recommendation With a very low price range and low beta we do like this ETF as a very low cost way to invest in Municipals in the ETF space during a possible rising rate environment. As many advisors and institutions have decided, this leader of the muni ETFs is an excellent place to invest funds for both the short and long term. As we stated in our analysis on other ETFs, we feel this ETF will continue to provide an attractive yield in a stable-to-slowly rising rate environment. We do expect slight price erosion in a rising rate environment but far less than other municipal funds and ETFs in the marketplace. We do not expect a decrease in yields in this ETF, bearing a large scale default and lower yields going forward. Overall, it is an attractive investment for stable yield-hungry institutions and individual investors alike. Disclosure: I/we have no positions in any stocks mentioned, and no plans to initiate any positions within the next 72 hours. (More…) I wrote this article myself, and it expresses my own opinions. I am not receiving compensation for it (other than from Seeking Alpha). I have no business relationship with any company whose stock is mentioned in this article. Additional disclosure: Information obtained from: ishares.com, morningstar.com, us.spindices.com,fidelity,com, yahoofinance.com, standardandpoors.com, moodys.com, wolfstreet.com,xtf.com, and our own analysis