Tag Archives: nysearcadbo

Trading Against Your Bias: How And Why

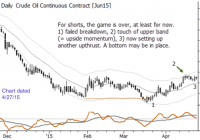
I initiated a short in crude oil back in July, and an astute reader sent me a good question. For many weeks/months, I had been operating with the assumption that crude oil was probably putting in a long-term bottom based on the action back in March/April of 2015; his question was how and why did I take a short against that bias. It’s a good and instructive question, so I thought I’d share the answer with you here. One of the advantages of writing about financial markets and publishing that work every day is that I have a record of what I was thinking and saying at any point in time. As I’ve written many times, I think journaling is one of the key skills of professional trading – this is a form of that. Let me set the background with some charts from a few months ago. A good place to start is in the aftermath of the 2014-2015 sell-off in crude oil. The market bounced in February 2015, set up another short attempt that more or less ran out of steam around the previous lows, and then rallied strongly off those March lows. In early April, I began to work with the idea that crude may have just put in a bottom. A chart says it better: (click to enlarge) Back in April, the case for a bottom in crude oil. Over the next few months, this thesis appeared to be playing out, but it’s important to remember that a bottom is a process. We don’t (usually) identify the absolute extreme of a move and then expect the market never to return. No, it’s far more likely that the market will go flat a while (check), and perhaps even re-test the previous extreme. This is normal, and it may even be those retests that really hammer the bottom in place. It’s easy to imagine hordes of traders thinking that crude oil is going to $20, entering short on a breakdown, and then watching in dismay as the market explodes to new highs after barely taking out the previous lows. A market will do whatever it can, at any time, to hurt the largest number of traders This, in fact, is nearly a principle of market behavior: A market will do whatever it can, at any time, to hurt the largest number of traders. That’s not just cynicism, I think it’s a legitimate consequence of the true nature of the market . Now, we certainly don’t want to be one of those gullible traders who gets tricked into shorting at exactly the wrong time, do we? So what do we do when the market gives us a nice, fat pitch right over the center of the plate, like this? A nice setup for a short, but what about the higher time frame conflict? And just to complete (or, perhaps, to further complicate) the picture, here’s the weekly chart from the same day: Thoughts on that higher time frame. So, just to clarify the situation here, in some bullet points, are the most important elements of market structure at the time we might have been thinking about a short entry: Within the past year, this market had a historic decline. Many people are inclined to think “Too far, too fast,” and that the move will reverse. On the other hand, maybe something fundamentally has changed. At the very least, we need to be aware that these might not be “normal” market conditions. After that historic decline, oil put in what looked like the first part of a bottom: A retest of lows, strong upside momentum off those lows, and then, daily consolidation patterns breaking to the upside. Following that step, the market went flat and dull, perhaps setting up a breakout trade. That breakout was to the downside, and a clear daily bear flag formed after the breakdown. Taking a short could mean going against the longer-term bottom (if it is forming), so what do we do? Many traders end up paralyzed with multiple time frames, as it’s easy to get overwhelmed with information. This is obviously a mistake, but there are also gurus who oversimplify the subject, saying, for instance, to only take a trade when it lines up with the higher-time frame trend. Though this idea is elegant and appealing, it falls short on several counts. For one, the best trades often come at turns, and if you wait to see an established trend, you’ll miss those trades; and even more importantly, the moving average-based trend indicators people use do not work like they think. (In fact, when a moving average trend indicator tells you a market is in an uptrend, at least for stocks, the stock is more likely go down !) Managing the conflicts How do we resolve all of this? I think this is a question that every trader must answer as part of his or her own trading plan. The one thing you probably cannot do is take each case as a new thing and try to make up rules for each situation. It’s far better to have a plan, and to then to follow that plan with discipline. For me, the answer is that a trade is just a trade. I have never been able to prove that having multiple time frames aligned actually increases the probability of those trades. (Though, those examples do sell books!) The way I think about it, if I have a higher-time frame trade that points up and a lower-time frame trade that points down, one of those trades will likely fail. I don’t know which, and I can’t know which in advance. If I knew the higher-time frame trend was more likely to work, I’d just trade that one, but in all intellectual honesty, I don’t know that. No one does. It’s possible that higher-time frame trend will fail because of the meltdown on the lower time frame, and if I’m positioned with that lower time frame, then I will be happy. It’s also possible I will get my first profit target even if the higher-time frame pattern “wins”, so I may be able to make money on both sides of the trade. Perhaps I want to skip the lower-time frame trade and just look for a higher-time frame trade around the previous low – that’s also a viable strategy. What matters is that I know what I will do in advance, and that I am honest about the limitations and constraints. We can only work within the laws of probability, and there are certainly limits to what can be known. It’s not a question of my competence as a trader, but of molding the methodology to fit the realities of the market. A trade is just a trade – avoid complications, and simplify.

Oil ETFs Gain On Lower U.S. Output Outlook

Fund holdings, ETF investing “}); $$(‘#article_top_info .info_content div’)[0].insert({bottom: $(‘mover’)}); } $(‘article_top_info’).addClassName(test_version); } SeekingAlpha.Initializer.onDOMLoad(function(){ setEvents();}); When it comes to economic growth, oil has been playing foul over the past one year. After terrible trading in the second half of 2014 and early 2015, oil has brought some respite and has been stuck in a tight range of $57-62 per barrel in recent weeks. While the drop in the U.S. oil rig count for the 26th straight week and billions of dollars in spending cuts are pushing the prices higher, the global oil glut has been the major headwind. However, this concern seems to be fading given the U.S. Energy Information Administration (EIA) report, which showed that the U.S. shale boom, the major source of global supply glut, is shrinking. The EIA expects oil production from the seven shale regions – Bakken, Eagle Ford, Haynesville, Marcellus, Niobrara, Permian and Utica – to fall by 1.3% to 5.58 million barrels a day in June and further by 1.6% to 5.49 million barrels a day in July. Additionally, total U.S. output will likely decline in the second half of the year through early 2016, as per the monthly report from the agency. Now, the agency sees U.S. oil production as averaging 9.4 million barrels per day for this year and 9.3 million barrels per day for the next, compared with 8.71 million barrels per day last year. On the other hand, the EIA also raised the global oil demand outlook to 93.3 million barrels per day for this year from 93.28 million barrels per day projected last month. Demand for 2016 is expected to see a jump to 94.64 million barrels per day. Given the new positive reports on demand/supply trends, both crude and Brent climbed over 3% on Tuesday, leading to impressive gains in the oil ETF world as well. The iPath S&P GSCI Crude Oil Total Return Index ETN (NYSEARCA: OIL ) was the biggest gainer on the day, rising about 3%, followed by gains of 2.75% for the United States Brent Oil ETF (NYSEARCA: BNO ), 2.54% for the United States Oil ETF (NYSEARCA: USO ) and 2% for the PowerShares DB Oil ETF (NYSEARCA: DBO ). These ETFs give investors direct access to dealings in the futures market (see: all the energy ETFs here ). The data from the American Petroleum Institute also led to the rally in oil prices and ETFs. As per the data, U.S. crude inventories fell by 6.7 million barrels in the week ended June 5 – the first weekly decline in three weeks. In today’s morning trading session, oil prices are also up more than 2% ahead of the inventory data, which suggests smooth trading by the ETFs in the coming days. The government data is expected to show that U.S. crude inventories fell at a faster pace by 1.7 billion barrels last week. Original Post Share this article with a colleague

The Trouble With Zero

On Tuesday afternoon, West Texas Intermediate Crude is up 6.5%, after having put in large gains the previous two days. Also typical of these types of headline grabbing moves is a parade of portfolio managers on CNBC who traded this exactly right and have no exposure. The point here is not to make a prediction about what oil will do, but to take this as a learning opportunity for market action that very frequently repeats. By Roger Nusbaum, AdvisorShares ETF Strategist As I write this on Tuesday afternoon, West Texas Intermediate Crude is up 6.5%, after having put in large gains the previous two days. Last Thursday it was around $44.58, and right now it is $52.76, which makes for an 18% gain in three trading days. We have watched the decline in crude, noting the slow decline that started in June that then turned into a crash starting at around $75 at Thanksgiving. The circumstances of crashes are always “different”, but the market action is very similar almost every time, and the oil market is showing the same pattern for now. The usual arc is a crash, which triggers an emotional response begetting more selling, and then the extrapolators coming out and telling us why the price move will go much further in the same direction; in this case, there were calls for $25-30 per barrel. Then, for no reason at all, the price turns in the other direction and snaps back very quickly. Also typical of these types of headline-grabbing moves is a parade of portfolio managers on CNBC who traded this exactly right and have no exposure. I imagine that if the move to $52 is sustainable or keeps going, then there will be another parade of portfolio managers on CNBC who all loaded up with overweight positions last Thursday below $45. The point here is not to make a prediction about what oil will do, but to take this as a learning opportunity for market action that very frequently repeats. I made a couple of small changes to the volatility of my energy exposure a couple of months ago, but nowhere close to zero exposure, because while I had no idea how low oil prices would go, the selling was clearly emotional – and emotional selling often stops for no apparent reason, and prices retrace some large portion of the crash very quickly (repeated for emphasis). It would have been great to have loaded up on energy stocks last Thursday, but I didn’t – but by not going to zero, I am capturing the lift that has been happening in the last three days. As one of the big market sectors, energy is a big portion of a diversified equity portfolio – and going to zero, as we’ve talked about many times before, is a big bet, and big bets by definition are risky. I looked at a couple of domestic energy sector ETFs which are both up about 7% in the last three days. Did any of the pundits with zero exposure last week buy today? If so, what happens to those ETFs if oil goes right back down to $44? If they did not buy back in, what will happen to those ETFs if crude goes back to $75 or $100? When do they get back in? This is a great example of why I believe zero is a big bet not worth making. Disclosure: The author has no positions in any stocks mentioned, and no plans to initiate any positions within the next 72 hours. (More…) The author wrote this article themselves, and it expresses their own opinions. The author is not receiving compensation for it. The author has no business relationship with any company whose stock is mentioned in this article. Additional disclosure: The point here is not to make a prediction about what oil will do but to take this as a learning opportunity for market action that very frequently repeats. AdvisorShares is an SEC registered RIA, which advises to actively managed exchange traded funds (Active ETFs). The article has been written by Roger Nusbaum, AdvisorShares ETF Strategist. We are not receiving compensation for this article, and have no business relationship with any company whose stock is mentioned in this article.