Tag Archives: premium-authors

Technology And TIPS: Two ETFs Trading With Outsized Volume

In the past trading session, U.S. stocks were in red because the Apple stock plunged to its six-month low and rising rate speculations suddenly sharpened. With considerable exposure in three key U.S. indices, Apple weighed on the overall U.S. market. Among the top ETFs, investors saw SPDR S&P 500 Trust (NYSEARCA: SPY ) , SPDR Dow Jones Industrial Average ETF (NYSEARCA: DIA ) , and PowerShares QQQ Trust ETF (NASDAQ: QQQ ) each move lower by about 0.2% on the day. Two more specialized ETFs are worth noting in particular, though, as both saw trading volume that was far outside of normal. In fact, both these funds experienced volume levels that were more than double their average for the most recent trading session. This could make these ETFs ones to watch in the days ahead to see if this extra-interest continues: First Trust Tech AlphaDEX ETF (NYSEARCA: FXL ): Volume 3.90 times average This U.S. technology ETF was under the microscope yesterday as nearly one million shares moved hands. This compares to an average trading day of 269,000 shares. FXL lost 0.7% in the session. The movement can be attributed to muted tech earnings. The pain in Apple shares pulled another trigger for this busy activity. FXL was down over 1.8% in the past month; though it currently has a Zacks ETF Rank #3 (Hold). iShares TIPS Bond ETF (NYSEARCA: TIP ): Volume 3.72 times average This U.S. TIPS ETF was in focus yesterday as over 2 million shares moved hands compared to an average of roughly 560,000 shares. We also saw some price movement as TIP dropped nearly 0.6% yesterday. The move yesterday was largely the result of subdued U.S. inflation as this can have a big impact on securities like what we find in this ETF’s portfolio. For the past one-month period, TIP was off 0.6%. Original Post Share this article with a colleague

Expensive Junk Stocks Are Killing High-Quality Value Stocks, YTD

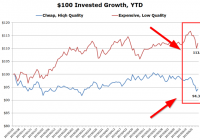
By Wesley R. Gray, Ph.D. In general, investors focused on affordable stocks with strong fundamentals have been taken to the cleaners year-to-date. Meanwhile, expensive stocks with poor fundamentals have been rocking ! Some Basic Statistics: Below, we document some core performance figures using Ken French’s data on value/growth portfolios (proxy for cheap/expensive) and high-profitability/low-profitability portfolios (proxy for high-quality/low-quality). We look at the value-weight returns for the top and bottom decile portfolios. The monthly returns runs from 1/1/2015 to 6/30/2015. Results are gross of fees. All returns are total returns, and include the reinvestment of distributions (e.g., dividends). Specifically, here are the four portfolios: Expensive = Value-weight returns to the bottom decile formed on B/M. Cheap = Value-weight returns to the top decile formed on B/M. Low-Quality = Value-weight returns to the bottom decile formed on profitability. High-Quality = Value-weight returns to the top decile formed on profitability. Here are the month-by-month results – a nasty year for cheap value stocks (as proxied by B/M) and high-quality stocks (as proxied by profitability): Month Expensive Cheap Outcome Low-Quality High-Quality Outcome 201501 0.04% -6.87% Lose -1.68% -2.17% Lose 201502 6.71% 3.56% Lose 9.64% 6.55% Lose 201503 -0.69% -1.59% Lose -0.31% -0.66% Lose 201504 0.19% 1.81% Win -0.53% 0.80% Win 201505 2.17% 0.58% Lose 5.18% 0.78% Lose 201506 0.61% -0.71% Lose -1.38% -1.24% Win The results are hypothetical, and are NOT an indicator of future results, and do NOT represent returns that any investor actually attained. Indexes are unmanaged, do not reflect management or trading fees, and one cannot invest directly in an index. Additional information regarding the construction of these results is available upon request. How have Expensive Low-Quality Stocks Performed Relative to Cheap High-Quality Stocks? In this section we look at the YTD performance of expensive low-quality stocks versus cheap high-quality stocks. We examine value-weight returns for the cheap high-quality quintile and the expensive low-quality quintile. The daily returns run from 1/1/2015 to 6/30/2015. Results are gross of fees. All returns are total returns, and include the reinvestment of distributions (e.g., dividends). Specifically, here are the two portfolios: Cheap, High-Quality = Value-weight returns to the cheap high-quality quintile . Expensive, Low-Quality = Value-weight returns to the expensive low-quality quintile . (click to enlarge) The results are hypothetical, and are NOT an indicator of future results, and do NOT represent returns that any investor actually attained. Indexes are unmanaged, do not reflect management or trading fees, and one cannot invest directly in an index. Additional information regarding the construction of these results is available upon request. Year-to-date, a portfolio of cheap high-quality socks is down around 6% , before fees and expenses (probably more like -7% if those were included). In contrast, a portfolio of the most expensive, lowest-quality firms is up around 12% , before fees and expenses (probably around 11% after fees). On net, the spread is almost 18% YTD. Incredible, but not unsurprising . When we look to the marketplace for live strategies focused on market-neutral strategies anchored on cheapness and quality, Gotham Funds’ Gotham Neutral Fund (MUTF: GONIX ) is probably the most prominent example. The fund isn’t completely market-neutral, but at a 25% net long exposure, that is about as close as we’re gonna get. YTD, the Gotham Neutral Fund is down 10.39%. That is pretty terrible, and it would have been worse if they were truly market-neutral, but in the context of the results above, where one goes long generic value/quality and short generic expensive/junk, -10%+ isn’t half bad . One could argue on a factor basis that they added value (I know, that sounds odd). As we’ve said time and time again, active value investing has been digging manager graveyards since 1900 … but that is the nature of the active value investing game… long horizons are required, and volatility relative to the standard benchmarks can be expected. Original Post

A Pleasant Surprise Among Emerging Market ETFs

Broadly speaking, these are not the best of times for emerging market exchange traded funds. India large-cap ETFs have been significantly better or less bad than other single-country and diversified emerging markets ETFs over the past month. In the near term, India ETFs could pullback following the Reserve Bank of India’s decision Tuesday to hold interest rates at 7.25 percent. By Todd Shriber, ETF Professor Broadly speaking, these are not the best of times for emerging market exchange traded funds. Things are so bad that 22 emerging markets funds hit 52-week lows on Monday. Since the star of the current quarter, the iShares MSCI Emerging Markets ETF (NYSEARCA: EEM ) has bled nearly $2.5 billion in assets. However, there is some light among the darkness and it comes courtesy of Indian small-caps. India large-cap ETFs have been significantly better or less bad than other single-country and diversified emerging markets ETFs over the past month, but funds such as the Market Vectors India Small-Cap Index ETF (NYSEARCA: SCIF ) , the EGShares India Small Cap ETF (NYSEARCA: SCIN ) and the iShares MSCI India Small Cap Index ETF (BATS: SMIN ) have legitimately impressed . While the MSCI Emerging Markets Index has tumbled 5.6 percent over the past month, the aforementioned trio of India small-cap ETFs posted an average return of almost 5.5 percent. This is not unfamiliar territory for India ETFs, which were the shining stars of the BRIC quartet last when emerging markets equities slumped. In the near term, India ETFs could pullback following the Reserve Bank of India’s decision Tuesday to hold interest rates at 7.25 percent, but the central bank has obliged with three rate cuts earlier this year, at least two of which can be considered surprises. Interestingly, the gains for Indian small-caps over the past month arrived as investors pulled $35 million from Indian stocks last month, still a scant percentage of the $7.1. billion that has flowed into stocks in Asia’s third-largest economy this year, according to Bloomberg . Divergent Returns Significant differences between the India small-cap ETFs tell the story of divergent returns. For example, the Market Vectors India Small-Cap Index ETF features a 21.2 percent to consumer discretionary stocks, leveraging the ETF to India’s burgeoning consumer story. SMIN, the iShares offering, is also a play on India’s resurgent domestic economy with a 44.3 percent allocation to financial services and industrial names. The EGShares India Small Cap ETF devotes over half its weight to financial stocks and industrials. A BlackRock fund manager recently sounded a bullish tone on Indian non-bank financials and select sub-sectors of the industrial space. Though the fund manager did not mention the ETFs highlighted here, institutional support for Indian small-caps should drive the likes of SCIF, SCIN and SMIN higher. Indian small-caps are not a bump-free ride. For example, SCIF has a three-year standard deviation of almost 32 percent, or 2 1/2 times that of the MSCI Emerging Markets Index. However, Indian small-cap, at least as measured by SCIF and SCIN, are not excessively valued. SCIF sports a price-to-earnings ratio of just 11 , while SCIN’s price-to-book ratio is just 1.16. Disclaimer: Neither Benzinga nor its staff recommend that you buy, sell, or hold any security. We do not offer investment advice, personalized or otherwise. Benzinga recommends that you conduct your own due diligence and consult a certified financial professional for personalized advice about your financial situation. Disclosure: I/we have no positions in any stocks mentioned, and no plans to initiate any positions within the next 72 hours. (More…) I wrote this article myself, and it expresses my own opinions. I am not receiving compensation for it. I have no business relationship with any company whose stock is mentioned in this article.