Tag Archives: premium-authors

Time For Airline ETF After Solid Earnings Season?

The airline stocks, which were flying low for the last three months on a stronger dollar and global growth worries cutting back on frequent flies, gained altitude and picked up speed following robust earnings this season. As a result, the pure-play aviation ETF U.S. Global Jets ETF (NYSEARCA: JETS ), which lost 2.9% in the last three-month period, advanced about 5% in the last one month (as of July 29, 2015) . In any case, cheap fuel has been a windfall for long. The mounting middle-income population in emerging markets is benefitting worldwide customer growth. Now solid earnings results from top-notch companies have come as a feather in the cap. To add to this, United Continental Holdings Inc. (NYSE: UAL ) recently reduced its 2015 domestic capacity growth outlook. Delta Airlines (NYSE: DAL ) too plans to raise the rewards’ program fare prices from June 1, 2016. All these initiatives by major industry players are likely to shore up the pricing profile of the sector. The sector is now in the top 44% category of the Zacks Industry Ranks. Let’s take a look at some of key earnings of the sector: Delta Air Lines reported impressive better-than-expected earnings and revenues in the second quarter of 2015. To lessen the unfavorable impact of foreign exchange on its international operations, Delta plans to slash its international capacity by 3.5% in the fourth quarter of 2015. Delta’s domestic revenues were strong with about 5% growth. Delta expects weak fuel prices to stay and continue to benefit earnings for the rest of the year. The carrier projects fuel costs per gallon in the band of $1.90 to $2.00 in the second half which is way below $2.65 per gallon noticed in the first half of 2015. The average fuel price at Delta in the second quarter of 2015 was $2.40 per gallon, down 18% sequentially. This Zacks ETF Rank #3 (Hold) stock has a Zacks Growth & Value style score of ‘A’. United Continental came up with mixed Q2 results this month with an earnings beat and a revenue miss. Earnings were up 41.5% year over year on lower fuel costs. Revenues declined 4% on lower passenger revenues. Cargo revenues and other revenues were also downhill. Its indicators are also very promising with a Zacks ETF Rank #3, Growth, Value and Momentum scores of ‘A’. Yet another leading U.S. carrier Southwest Airlines Co. ‘s (NYSE: LUV ) second-quarter 2015 bottom line matched the Zacks Consensus Estimate while the top line missed the same. But investors should notice that revenues grew 2% year over year helped by 2.1% and 4.5% expansion in Passenger and Freight revenues, respectively. Airline traffic was up 7.9% while passenger load factor inched up to 84.6% from 83.9% recorded in the year-ago quarter. LUV, with a Zacks ETF Rank #3, also boasts hopeful indicators of Growth score of ‘B’ and Value score of ‘A’. American Airlines Group (NASDAQ: AAL ) had a mixed quarter with a bottom-line beat and top line miss. Though this is a Zacks ETF Rank #5 (Strong Sell) stock and its operating metrics were downbeat in Q2, the company is worth a look as it emphasizes shareholder returns. The board of directors has authorized an additional $2 billion share buyback program. This stock is also a great pick for growth and value investors. Apart from these heavy-weight stocks, the sector has seen sturdy performances by others. Alaska Air Group, Inc. ‘s (NYSE: ALK ) Q2 2015 earnings per share of $1.76 beat the Zacks Consensus Estimate of $1.73 and improved 56% from the year-ago earnings. Revenues grew 5% year over year and matched our estimates. It is a Zacks ETF Rank #2 (Buy) stock with a Growth and Value scores of ‘A’. Though JetBlue Airways Corporation ‘s (NASDAQ: JBLU ) second-quarter 2015 earnings per share matched the Zacks Consensus Estimate and revenues missed the same, the top and bottom lines grew year over year. JBLU has a Zacks ETF Rank #2, Growth and Value scores of ‘A’ and a Momentum score of ‘B’. By now, one must have realized that the underlying trend is solid in the airlines industry. So, investors might play the trend via basket approach to tap the entire potential of the space. And to do so, what could be the best option other than JETS ETF? The fund holds 33 stocks in its portfolio and is concentrated on a few individual securities, as it allocates about 70% to the top 10 holdings. United Continental (12.4%), Delta Airlines (12.33%), Southwest (12.23%) and American Airlines (11.04%) are the top four elements in the basket, with a combined share of about 45%. Other firms mentioned above also get places in the top 10 chart, each with over 4% weight. The product charges 60 bps in fees. Link to the original article on Zacks.com
Mutual Fund Investors Take Wait-And-See Approach Ahead Of FOMC Meeting

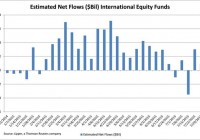
By Tom Roseen Despite the flight to safety and what many market pundits might have expected-a subsequent uptick in flows to money market funds, for the second week in three investors were net redeemers of fund assets (including those of conventional funds and exchange-traded funds [ETFs]), withdrawing a net $6.2 billion for the fund-flows week ended, Wednesday, July 29. Investors pulled money out of all four of Lipper’s major macro-groups, redeeming $3.5 billion from taxable bond funds, $1.8 billion from equity funds, $0.9 billion from money market funds, and $73 million from municipal bond funds. Weak earnings reports from bellwether stocks such as American Express (NYSE: AXP ), Caterpillar (NYSE: CAT ), and 3M (NYSE: MMM ), accompanied by a hangover from China’s market meltdown, outweighed a drop in weekly applications for unemployment benefits to the lowest level since 1973. Investors shrugged off a better-than-expected earnings report from Amazon and ignored the Anthem (NYSE: ANTM )-Cigna (NYSE: CI ) M&A news and the announcement that Greek officials had approved a second set of austerity measures. Instead, investors focused on the continued decline in oil, the selloff in commodities, concerns over a decline in global economic growth, and a housing report that showed the largest slowdown in single-family-home sales in seven months. Ho-hum economic data and sketchy guidance from U.S. firms during the flows week initially led investors to safe-haven plays, especially after the Shanghai Composite’s largest one-day slide (-8.5%) since February 2007. Despite a better-than-expected June durable goods report, investors took a wait-and-see approach ahead of the two-day Federal Open Market Committee meeting, leading to a small rally in U.S. Treasuries. However, in the last two days of the flows week U.S. stocks rallied after China stocks showed a more tempered decline and oil prices rose for the first time in five sessions. On Wednesday, July 29, the Dow marked its fifth straight session of triple-digit moves, this time to the upside after the Federal Reserve left itself wiggle room to raise rates as early as September, citing a continuation of solid gains in the job market. Investors cheered Citrix’s better-than-expected earnings report, Chinese stocks moved higher, and crude oil had its second biggest one-day gain for July, with futures rising 1.7% for the day. Nonetheless, the Dow Jones Industrial Daily Reinvested Average still finished the flows week down 0.56%. (click to enlarge) Source: Lipper, a Thomson Reuters company Interestingly, fund investors collectively kept their foot on the gas pedal for a few risk-on plays, injecting net new money into international equity funds (+$0.9 billion), health/biotechnology funds (+$0.6 billion), mid-cap funds (+$0.2 billion), and science & technology funds (+$0.1 billion). Except for small net flows into government/Treasury funds (+$0.4 billion) during the week, the typical safe-haven plays didn’t attract net new money as investors appeared to be waiting on the policy statement by the Fed to plan their next steps. Year to date, international equity funds (including traditional funds and ETFs) have attracted $135.1 billion of net new money, while their domestic equity counterparts have suffered net redemptions to the tune of $54.7 billion.

Oil ETFs Slide Again: More Pain In Store?

After smooth trading in May and June, oil resumed its decline and trapped in the nastiest downward spiral in July joining the broader selloff in commodities amid the growing global glut and the China slowdown. In fact, U.S. crude oil lost nearly 21% in July, which was the worst month since October 2008. The rout worsened in the first session of August with crude plunging as much as 5% on Monday to around $45.17 per barrel. On the other hand, Brent oil dropped to below $50 per barrel for the first time since January. Inside the Recent Slump The brutal trading on Monday can be attributed to the increase in the number of rig counts, weak China manufacturing data, and downbeat U.S. economic data on manufacturing and construction spending that suggests tepid oil demand growth around the world. China manufacturing activity unexpectedly fell to a two-year low in July, adding to worries on the world’s second-largest economy. Meanwhile, U.S. manufacturing also slipped in July and consumer spending advanced at its slowest pace in four months in June, indicating that the world’s largest economy is losing momentum yet again. Coming to the supply side, the Organization of Petroleum Exporting Countries (OPEC) is pumping up maximum oil in the recent past buoyed up by higher output from Iraq and Saudi Arabia. It is currently producing about 32 million barrels a day against its target of 30 million barrels a day. Additionally, Iran, the world’s fourth-largest reserve holder with 158 billion barrels of crude oil, is gearing up to boost its production immediately after sanctions are lifted, which is expected in late November. As per Iran’s oil minister, Bijan Namdar Zanganeh, production will likely increase by 500,000 barrels a day within a week after relaxation in sanctions and by 1 million barrels a day within a month. Further, oil production in the U.S. has been on the rise and is hovering around its record level. ETF Impact Terrible trading has been felt in the ETF world as well, sending oil ETFs tracking the futures contract in deep red from a one-month look. In particular, the iPath S&P GSCI Crude Oil Index ETN (NYSEARCA: OIL ) stole the show tumbling 19.6%, followed by over 17% declines in the United States Oil Fund (NYSEARCA: USO ) ), the iPath Pure Beta Crude Oil ETN (NYSEARCA: OLEM ) and the United States Brent Oil Fund (NYSEARCA: BNO ) . Two of the most popular leveraged oil ETFs – the ProShares Ultra Bloomberg Crude Oil ETF (NYSEARCA: UCO ) and the VelocityShares 3x Long Crude Oil ETN (NYSEARCA: UWTI ) – dropped 46.4% and 33%, respectively, in the same time frame. The former provides twice the return of the daily performance of the Bloomberg WTI Crude Oil Subindex while the latter delivers thrice the returns of the S&P GSCI Crude Oil Index Excess Return. Both indices consist of WTI crude oil futures contracts. What Lies Ahead? With deteriorating demand/supply dynamics, the prospect of an oil price rebound in the second half looks faded. In fact, there is a clear sign that oil price might revisit its previous low of the year, pushing the oil ETFs further down. This is especially true as speculators betting on rising oil prices have fallen sharply in recent weeks. Hedge funds reduced their net-long position in WTI to the lowest level in five years for the week ended July 28, according to the U.S. Commodity Futures Trading Commission data. Further, money managers also cut their bullish bets on Brent by 37,527 contracts for the same week, representing the biggest decline since July 2014, as per data from the ICE Futures Europe exchange. That being said, inverse ETFs have been on the tear over the past one month with the VelocityShares 3x Inverse Crude ETN (NYSEARCA: DWTI ) , the ProShares UltraShort Bloomberg Crude Oil ETF (NYSEARCA: SCO ) and the PowerShares DB Crude Oil Double Short ETN (NYSEARCA: DTO ) gaining 68.4%, 42.2% and 30.9%, respectively. As a result, investors bearish on oil could make a short-term play on these ETFs for big gains in a short span, especially if the “trend remains a friend” in this corner of the investing world. Link to the original article on Zacks.com