Scalper1 News
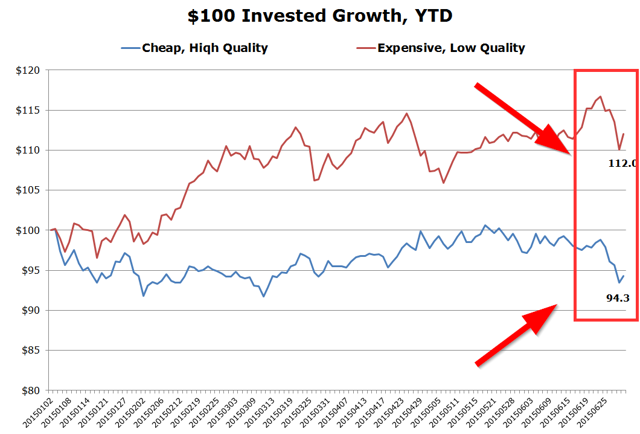
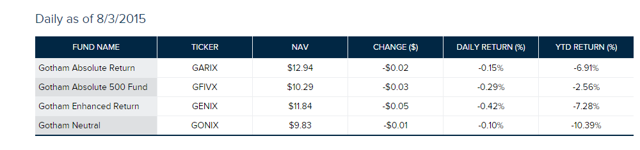 By Wesley R. Gray, Ph.D. In general, investors focused on affordable stocks with strong fundamentals have been taken to the cleaners year-to-date. Meanwhile, expensive stocks with poor fundamentals have been rocking ! Some Basic Statistics: Below, we document some core performance figures using Ken French’s data on value/growth portfolios (proxy for cheap/expensive) and high-profitability/low-profitability portfolios (proxy for high-quality/low-quality). We look at the value-weight returns for the top and bottom decile portfolios. The monthly returns runs from 1/1/2015 to 6/30/2015. Results are gross of fees. All returns are total returns, and include the reinvestment of distributions (e.g., dividends). Specifically, here are the four portfolios: Expensive = Value-weight returns to the bottom decile formed on B/M. Cheap = Value-weight returns to the top decile formed on B/M. Low-Quality = Value-weight returns to the bottom decile formed on profitability. High-Quality = Value-weight returns to the top decile formed on profitability. Here are the month-by-month results – a nasty year for cheap value stocks (as proxied by B/M) and high-quality stocks (as proxied by profitability): Month Expensive Cheap Outcome Low-Quality High-Quality Outcome 201501 0.04% -6.87% Lose -1.68% -2.17% Lose 201502 6.71% 3.56% Lose 9.64% 6.55% Lose 201503 -0.69% -1.59% Lose -0.31% -0.66% Lose 201504 0.19% 1.81% Win -0.53% 0.80% Win 201505 2.17% 0.58% Lose 5.18% 0.78% Lose 201506 0.61% -0.71% Lose -1.38% -1.24% Win The results are hypothetical, and are NOT an indicator of future results, and do NOT represent returns that any investor actually attained. Indexes are unmanaged, do not reflect management or trading fees, and one cannot invest directly in an index. Additional information regarding the construction of these results is available upon request. How have Expensive Low-Quality Stocks Performed Relative to Cheap High-Quality Stocks? In this section we look at the YTD performance of expensive low-quality stocks versus cheap high-quality stocks. We examine value-weight returns for the cheap high-quality quintile and the expensive low-quality quintile. The daily returns run from 1/1/2015 to 6/30/2015. Results are gross of fees. All returns are total returns, and include the reinvestment of distributions (e.g., dividends). Specifically, here are the two portfolios: Cheap, High-Quality = Value-weight returns to the cheap high-quality quintile . Expensive, Low-Quality = Value-weight returns to the expensive low-quality quintile . (click to enlarge) The results are hypothetical, and are NOT an indicator of future results, and do NOT represent returns that any investor actually attained. Indexes are unmanaged, do not reflect management or trading fees, and one cannot invest directly in an index. Additional information regarding the construction of these results is available upon request. Year-to-date, a portfolio of cheap high-quality socks is down around 6% , before fees and expenses (probably more like -7% if those were included). In contrast, a portfolio of the most expensive, lowest-quality firms is up around 12% , before fees and expenses (probably around 11% after fees). On net, the spread is almost 18% YTD. Incredible, but not unsurprising . When we look to the marketplace for live strategies focused on market-neutral strategies anchored on cheapness and quality, Gotham Funds’ Gotham Neutral Fund (MUTF: GONIX ) is probably the most prominent example. The fund isn’t completely market-neutral, but at a 25% net long exposure, that is about as close as we’re gonna get. YTD, the Gotham Neutral Fund is down 10.39%. That is pretty terrible, and it would have been worse if they were truly market-neutral, but in the context of the results above, where one goes long generic value/quality and short generic expensive/junk, -10%+ isn’t half bad . One could argue on a factor basis that they added value (I know, that sounds odd). As we’ve said time and time again, active value investing has been digging manager graveyards since 1900 … but that is the nature of the active value investing game… long horizons are required, and volatility relative to the standard benchmarks can be expected. Original Post Scalper1 News
Scalper1 News