Tag Archives: portfolio

Is UNG On Its Road To Recovery?
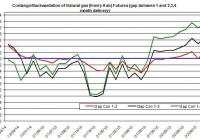
Summary The price of UNG rallied in recent weeks. The colder-than-normal weather could further push up the demand for natural gas. The storage is still expected to be higher than normal by the end of March. The energy market has started to heat up again as the price of The United States Natural Gas ETF, LP (NYSEARCA: UNG ) rose by 4% since the beginning of the month. Let’s review the latest developments in the natural gas market. In the natural gas futures market, there is a change, in which the market is slowly moving from backwardation to contango. The contango in the futures market indicates an expected rise in natural gas prices in the subsequent weeks. But a rise in the contango could also result in UNG underperforming natural gas prices due to roll decay. The chart below presents the changes in the contango/backwardation in the futures market for the coming months. Source of data taken from EIA The weakness in the natural gas market was driven by lower-than-normal demand for heating this winter. During the past several weeks, the average extraction from the natural gas underground storage was around 81 Bcf per week, as indicated in the table below. Source of data taken from EIA In the past week, the EIA reported a 160 Bcf withdrawal from storage, which was slightly below market expectations and lower than the 5-year average – 178 Bcf. The extraction from storage tends to last until the end of March. So we are likely to have only a month and a half more of withdrawals from storage. Next week, the extraction is expected to be close to the 5-year average. The average deviation from temperatures was only around 1.81; this suggests, at face value, an extraction from storage of around 180 Bcf. Since the week-over-week changes also include a lot of noise, these conclusions should be taken with more than a grain of salt. Last week, the demand for natural gas declined by 7.6% and was nearly 20% below the demand recorded the same week last year. Conversely, production continues to slowly pick up (rose by 0.1% in the past week) and is 13% higher than last year. According to the latest news from Baker Hughes (NYSE: BHI ), gas rigs have dropped by 14 to reach 300 rigs. Despite the drop in demand, it’s still well above the supply, which is likely to maintain a high level of volatility in UNG prices in the near term. The demand for natural gas is likely to pick up in the coming weeks on account of expected lower-than-normal weather throughout the East, including the Midwest and Northeast. Moreover, heating degree days are projected to be higher than normal, which could also suggest a rise in demand for natural gas for heating purposes. The big picture, however, still shows the natural gas storage to be slightly above the 5-year average level by April. The EIA also projects, for now, the underground storage to be around 43 Bcf above the 5-year average by the end of March – it will reach a total of 1,699 Bcf. Despite the drop in rig count and only modest gain in production in the past week, the storage continues to fall at a slower pace than normal, which is likely to bring it above the 5-year average by the end of the extraction season. The colder-than-normal weather could bring back up UNG prices in the near term, but this rally may not last long if production keeps building up and demand doesn’t exceed current market expectations. For more see: Contango in Natural Gas Market Disclosure: The author has no positions in any stocks mentioned, and no plans to initiate any positions within the next 72 hours. (More…) The author wrote this article themselves, and it expresses their own opinions. The author is not receiving compensation for it (other than from Seeking Alpha). The author has no business relationship with any company whose stock is mentioned in this article.
Don’t Feel Bad If You’re Not Making Money In This Market

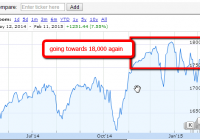
Summary The Dow is clawing back to its all-time high, and how it affects investors. Hedge fund performances suck, but are you getting suckered in to the hype? There is a need to reassess your attitude towards risk during market cycles. The Dow is just below its all-time high again. After all these years of a bull run, Mr. Market is still giddy with excitement and wants you to join the ride. But while Mr. Market puts on his charm during this upward market, I am reminded of Howard Marks’ memo titled “Ditto” which goes over market psychology and investor sentiment. But First… You are Missing Out Feel like everyone else is making money except you? Are you missing out on this market upside? Well, that’s a lie because in 2014, hedge funds performed miserably. The average hedge fund performance was under 3%. 2012 and 2011 weren’t impressive either. If at any point during the past few months or years you thought to yourself “I’m missing out”, then you are not alone. However, you shouldn’t be worried or concerned. If the best investors can’t get anywhere near the indexes, then you have no chance of doing any better, right? Wrong. You and I know that investing should be emotionless, but one of the easiest ways to get emotional is when you feel like you need to act to keep up, or when you start comparing yourself to other investors. The difficult part is ignoring the itch that makes you want to get trigger happy. In fact, we should be focusing on limiting our risk by understanding how market cycles affect us. Over the years, I’ve become convinced that fluctuation in investor attitudes toward risk contributes more to major market movements than anything else. I don’t expect this to ever change. – Howard Marks It’s bull markets like these where it just seems like everything is going up where many people crumble and get suckered in to buying stocks that they otherwise would not buy. Simply because they do not want to get left behind. Herd mentality isn’t just about buying whatever the next person is buying. Herd mentality exists primarily because of human behavior and getting caught up in emotions. So are you really missing out? Not at all. That’s what your emotions are telling you. Not what your logic is telling you. The Cycle in Attitudes towards Risk I’m sure you have seen the image below. And to complement this, here is Howard Marks’ version. 1. When economic growth is slow or negative and markets are weak, most people worry about losing money and disregard the risk of missing opportunities. Only a few stout-hearted contrarians are capable of imagining that improvement is possible. 2. Then the economy shows some signs of life, and corporate earnings begin to move up rather than down. 3. Sooner or later, economic growth takes hold visibly and earnings show surprising gains. 4. This excess of reality over expectations causes security prices to start moving up. 5. Because of those gains – along with the improving economic and corporate news – the average investor realizes that improvement is actually underway. Confidence rises. Investors feel richer and smarter, forget their prior bad experience, and extrapolate the recent progress. 6. Skepticism and caution abate; optimism and aggressiveness take their place. 7. Anyone who’s been sitting out the dance experiences the pain of watching from the sidelines as assets appreciate. The bystanders feel regret and are gradually suckered in. 8. The longer this process goes on, the more enthusiasm for investments rises and resistance subsides. People worry less about losing money and more about missing opportunities. 9. Risk aversion evaporates and investors behave more aggressively. People begin to have difficulty imagining how losses could ever occur. And so goes the path towards a mania or bubble. How to Keep Your Emotions In Check One of the easiest methods of controlling your emotions is to know the value of your companies. I just love how Prof. Damodaran puts it in this previous article I wrote because it’s exactly how I process it. Valuation slows the process down, gives your rational side a chance to mount an argument. Most investors don’t want to hear about valuation because it challenges their desire to hear what they want about their holdings. But valuation is the compass that keeps you on the right path. My valuations are not always correct, but it’s saved my bacon on so many occasions. It’s not just about finding undervalued stocks to buy, it also helps with selling stocks that have become expensive. You don’t know if it’s expensive unless you know what something is worth. That way, you can protect yourself from unnecessary losses. I love valuation and it’s the reason why I’m always using my stock analysis tool and checking my rationale with cold hard facts. Unless I find a legitimate reason for why I have to increase my valuation from $50 to $300 without solid evidence, it’s easy to recognize I’m fooling myself. This is NOT a Market Prediction Even with the Dow just over 18,000, I have no opinion on whether the market is undervalued or overvalued. It’s easier for individual companies, but more difficult for an index. All I know is that there are always pockets of opportunity available. The main idea I want to share is to not fall victim to feeling like you are missing out. Keep your risk assessment in check and let the market do what the market does. Invest independent of the market. In this interview with Mohnish Pabrai , Pabrai talks about how his fund was down 65% from the peak at one point, but his wife had no clue because his behavior pattern did not change. Even in a really bad year, he was sticking with his principles. You do not want to be in a place where you go from worrying about missing opportunities to worrying about losing money. Disclosure: The author has no positions in any stocks mentioned, and no plans to initiate any positions within the next 72 hours. (More…) The author wrote this article themselves, and it expresses their own opinions. The author is not receiving compensation for it. The author has no business relationship with any company whose stock is mentioned in this article.

2014 Diversified ETF Portfolio: Annual Performance, Replacing BOND With TLT And 2015 Estimates

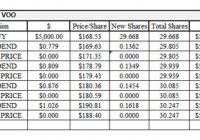
Summary The S&P 500 had another great year with 14% annual return (including dividends). The diversified portfolio only returned 3.6%, held back by Business Development Company ETF. Portfolio yield exceeded the S&P 500 by 118 basis points. Pimco’s BOND ETF was replaced by TLT. TLT chosen based on correlation. S&P 500 Fundamentals need to continue to grow to have a positive 2015 year. Here are the fourth quarter and full-year results of a diversified ETF portfolio. The holding in BOND was replaced with TLT because of a change in my thesis. BOND was included to cover the bond portion of the portfolio because my thesis was that the expertise of Bill Gross would help BOND perform during calendar year 2014. Once Bill Gross quit Pimco, it was time for a change. Q1 Update: Link Q2 Update: Link Q3 Update: Link MARKET PERFORMANCE The S&P 500, as measured by the Vanguard S&P 500 ETF (NYSEARCA: VOO ), was up 13.97% (including dividends) for CY2014. Not too shabby. (click to enlarge) Eight of the nine sectors were positive for the year. Energy was the one sector that was negative. Technology, health, and utilities all outperformed the S&P 500. The utilities sector was the best performer, up 24.4%, which is usually considered a safe harbor investment. According to my calculations, a portfolio equal weighted in each sector would have returned 11% for the year. Throughout CY2014, bond yields fell. Yields closed the year at 2.2%. There was a significant drop during Q4, which is reflected in the performance of TLT. A drop in yields results in a price increase for the bonds. PORTFOLIO PERFORMANCE For Q4, the portfolio was up 2% while the S&P 500 was up 4.89%. For the year, the portfolio was up 3.62% while the S&P 500 was up 13.97%. PowerShares Buyback Achievers (NYSEARCA: PKW ), PowerShares Fundamental Pure Small Value (NYSEARCA: PXSV ), and the iShares 20+ Year Treasury Bond ETF (NYSEARCA: TLT ) all outperformed the S&P 500 for the quarter. Market Vectors BDC Income ETF (NYSEARCA: BIZD ), Vanguard FTSE Emerging Markets ETF (NYSEARCA: VWO ), and SPDR Barclays High Yield Bond (NYSEARCA: JNK ) all posted negative returns for the quarter. (click to enlarge) For the year, only the Market Vectors BDC Income ETF was down; even with its high dividend yield, it was not able to generate a positive return. No one fund outperformed the S&P 500 for the year. The Buyback Achievers came close and the Small Value fund posted a decent rally at year’s end, along with the Bond ETF. (click to enlarge) Here is the performance of the portfolio for the year: BOND FUND REPLACEMENT Why did I replace PIMCO Total Return ETF with iShares 20+ Year Treasury Bond ETF? The purpose of the bond fund is to give some negative correlation to the portfolio and help smooth out some returns over a long time frame (I know, I am monitoring the portfolio on a quarterly basis). As soon as it was announced that Bill Gross was leaving Pimco, I ran a correlation matrix on several possible bond funds. I used the following funds: iShares TIPS Bond (NYSEARCA: TIP ) Vanguard Short-Term Infl-Prot Secs ETF (NASDAQ: VTIP ) iShares Core Total U.S. Bond Market ETF (NYSEARCA: AGG ) Vanguard Intermediate-Term Corp Bd ETF (NASDAQ: VCIT ) SPDR Barclays Capital Convertible Bond ETF (NYSEARCA: CWB ) iShares 20+ Year Treasury Bond Vanguard Short-Term Corporate Bond ETF (NASDAQ: VCSH ) Vanguard Long-Term Corporate Bond ETF (NASDAQ: VCLT ) Here are the results of the correlation matrix (as of 3-Oct-2014): (click to enlarge) TLT has the largest negative correlation to the three equity funds (PKW, BIZD, and PXSV) and therefore, I choose it as the replacement for BOND. Note: The ETF share price used for the correlation matrix was sourced from Yahoo! Finance. TIP came in a very close second. As an exercise, I took the 10 worst days for PXSV (01-Jan-2014 through 03-Oct-2014) and compared that with TLT and TIP. TIP actually had the least correlation over this time frame. LOOKING FORWARD Last year at this time, I estimated a 10% return for the S&P 500. The S&P 500 outpaced that estimate. I estimated a 4.5% increase in sales per share with an 8.5% EPS margin. The actual sales per share increase was only 3.5%, but the EPS margin was 9.18%, which resulted in an actual EPS of $105.96, as compared with my $99.07 EPS estimate. I estimated a 20.5 multiple but the multiple (for the trailing twelve months) came in at 19.4, still allowing a greater than 10% return for the S&P 500. How about for 2015? I looked at three scenarios below. With the continuing improving employment numbers and the recent robust GDP numbers, I would expect the S&P to return between 2.5% and about 14% for the year. Large range, I know. Looking at the three scenarios below, it does not take much degradation in the fundamentals to get a negative return for the year. I was surprised how easy it would be to get a -11% annual return, using what I would still consider to be some decent fundamental performance. (click to enlarge) Disclosure: The author is long VOO, VWO. (More…) The author wrote this article themselves, and it expresses their own opinions. The author is not receiving compensation for it (other than from Seeking Alpha). The author has no business relationship with any company whose stock is mentioned in this article.