Tag Archives: portfolio

How Cash Can Boost Long-Term Returns
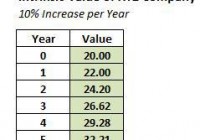
Summary Liquidity management is one of the most critical aspects of investment. Cash earns a 0% nominal return, but allows investors to take advantage of higher-return opportunities that may emerge. By holding more cash, one is betting that the purchasing power will increase at a future point. Moderation is key with holding cash; it’s rarely advisable to go to 100% cash or 0% cash. I’d recommend a cash position in the 20% – 40% range for most investors right now due to higher than average risks in the market. Buying stocks at depressed prices (i.e. with a large “margin of safety”) is the best way to generate superior returns over time. Cash, on the other hand, generates a 0% return. Absent a highly unlikely episode of hyper-deflation, you cannot become wealthy holding cash. In spite of this, I’d recommend holding 20% – 40% of your portfolio in cash right now. The reason for this is that there is value to liquidity, particularly in an inflated market environment. By holding cash, what you are actually doing is betting that the future value of your money in the market will be worth more than the present value. How can cash help you generate better returns? The key is to understand intrinsic value and the mathematics of investing. Intrinsic Value Price is what you pay for an asset. Intrinsic value is the fundamental worth of an asset. Therefore, an asset could be priced at $20,000, but have an intrinsic value of $30,000. In that instance, you are getting a bargain, because you are paying 33% less than the intrinsic value. In reality, it’s impossible to know the exact intrinsic value of a stock. None of us can see the future. Yet, we can come up with reasonable estimates of intrinsic value through a fundamental analysis of a company. That said, in order to explain why holding cash can be beneficial, we’ll first need to assume we can read the future. In this scenario, let’s say we know with absolute certainty that the intrinsic value of XYZ Company’s stock is $20. Now, we’re going to be able to live in five different alternate realities. In the first scenario, XYZ Company’s stock is selling at the depressed price of $5. In the second scenario, the stock sells at a still somewhat depressed price of $10. The third scenario will allow us to purchase the stock for $20; which is precisely the intrinsic value. In the fourth scenario the stock will sell at an inflated price of $25, and in the fifth scenario, it will sell at an even more inflated price of $30. Now, we’ll say that in each of our five alternate realities, we will purchase the stock and hold it for five years. We also know for a fact that the intrinsic value will grow 10% per year. You can see how the intrinsic value grows in the chart below. With that, let’s take a look at what happens. The Power of Compounding Now that we’ve created the set-up, you can see the return figures for all five scenarios below for a five-year holding period. It immediately becomes clear how dramatic the difference is between purchasing XYZ’s stock at a depressed price versus an inflated price. The “inflated price” only yields a 1.4% annual return, while the “depressed price” yields an astronomical 45.1% annual return! To put this further in perspective, if you started with $10,000 and generated a 45.1% annual return for the indefinite future, you would have $100,000 in a little over 6 years. On the other hand, if you generated a 1.4% for the foreseeable future, it would take you 166 years for you to turn that $10,000 into $100,000. That’s not a misprint! That’s the power of compounding. This is also the reason why an investor that generates a 17% annual return over 10 years is significantly better than one generating a 15% annual return. It may seem like a very small difference, but over a long-term timeframe, it really adds up. An investor making 15% annually on a $10,000 initial investment for 25 years would have $329,000 at the end of that timeframe. An investor generating a 17% annual return, on the other hand, would have $507,000; roughly 54% more. Why Cash is Valuable Given this math, it starts to become clearer why holding cash can sometimes led to higher long-term returns. Let’s say that XYZ’s stock was selling at the inflated price of $30, but you could see the future, and knew it could fall back down to $15 in 3 years. For simplicity’s sake, we’ll still assume that you plan to sell off at the end of Year #5 at the intrinsic value of $32.21. What would be your best option? (1) Buying the stock immediately and earning the 1.4% return for 5 years, (2) Holding cash for 3 years and then buying in at the semi-depressed price of $15 The answer is that option #2 is much more profitable. After five years, you’ll only generate a total return of 7.2% in Scenario #1, but you’ll achieve a 114.7% return in Scenario #2, in spite of the fact that you made a 0% return the first three years. This example showcases why the relationship between price and value are so important. It also shows why value investing works so well. What may seem like small differences in price can drive very large differences in return. Hold Some Cash Given the inflated market environment we are currently seeing, I believe it’s prudent to hold 20% – 40% of one’s portfolio right now. It’s true that you’ll likely underperform in the short-term (e.g. 1-3 years) as a result of this strategy. However, in the long-term, it makes more sense to take the 0% return now (on a part of your portfolio), and then use the liquidity to strike later when the returns become much more attractive. Of course, this should not dissuade you from taking advantage of bargains as you see them become available. And while I believe the broad market is overpriced, on a micro level, there will always be bargains out there. Yet, even if you can find a lot of bargains, I’d still recommend holding a good clip of cash, because even better bargains could become available the next time we find ourselves in a recession or a falling market environment. How much cash you hold in your portfolio depends upon your preferences and personal situation. If you’re in a situation where you can’t afford to lose much right now (i.e. you might need your cash for other purposes), I would recommend playing things fairly conservatively and holding a very large cash position. Even if you’re not worried about pulling out cash, I do think a minimum 10% cash position is prudent; and frankly, I wouldn’t dip below 20%. Conclusions Holding cash and generating a 0% return may seem like a poor option on the face of it, but once you understand the math behind returns, it makes a lot sense. By holding cash now, you’re hoping that you can generate higher returns in a future environment with lower prices. It’s never wise to go 100% cash, because at that point, you’re merely speculating. In an environment where stock prices seem inflated and there are few bargains out there, it makes sense to hold an elevated cash position in the range of 20% – 40% of your portfolio. On the other hand, in a depressed stock environment (such as the one we saw in late 2008 and early 2009), you should try to be as fully invested as possible, holding no more than 5% cash. Right now, I view us as being in an inflated environment and holding a 20% – 40% cash position is a prudent strategy. Your returns will lag in the short-term, but if there’s a market correction, you’ll more than make up for it in the long-term. This article appears in the February 2015 edition of Jake Huneycutt’s Contrarian Value Newsletter Disclosure: The author has no positions in any stocks mentioned, and no plans to initiate any positions within the next 72 hours. (More…) The author wrote this article themselves, and it expresses their own opinions. The author is not receiving compensation for it. The author has no business relationship with any company whose stock is mentioned in this article.

VALX: A New Guru ETF That Mimics The All-Time Greats

When it comes to investing, originality is overrated. You get no brownie points for using only your own research. Returns are returns. So, if you can piggyback on the research of famous investors like Warren Buffett or Peter Lynch, why wouldn’t you? I’ve spilt quite a bit of ink writing about assorted smart-money, guru-following strategies (see ” iBillionaire to Launch New Guru ETF “), all of which involve some variation of 13F mining. In a nutshell, if you want to know what a famous investor is buying, you need only look at the 13F filings they are required to file with the SEC. Several sites, including GuruFocus and Insider Monkey , track 13F filings, and there are currently three popular guru ETFs, including the Global X Top Guru Holdings Index ETF (NYSEARCA: GURU ), the AlphaClone Alternative Alpha ETF (NYSEARCA: ALFA ) and the Direxion iBillionaire Index ETF (NYSEARCA: IBLN ). Now, Validea Funds is taking the guru ETF in a new direction with the Validea Market Legends ETF (NASDAQ: VALX ). VALX, unlike its peers, does not mine the 13F filings of famous investors. Instead, it picks stocks by imitating the strategies of famous investors. It’s a matter of copying the style rather than the specific stocks. There are pros and cons to following this kind of approach. One obvious selling point is that you are not limited to the current pool of famous investors. The strategies used by investing legends that practiced decades ago, such as Benjamin Graham or Peter Lynch, can be included alongside those of managers that are in the trenches today. And there is also the matter of timing. The mining of 13F filings is an exercise in tracking what the smart money has already done, and by the time you get the information it might already be dated. By emulating the underlying strategy instead, you can potentially invest ahead of the manager whose strategy you are ostensibly cloning! Of course, the obvious downside, particularly when looking at the strategies of long-retired managers, is that we can’t say with any certainty whether that manager would still be using those strategies were they in the business today. Many of Benjamin Graham’s favorite strategies are all but unusable today because the market is a lot more efficient than it was when Graham was investing. If Graham were alive and practicing today, I have no doubt that he could compete with the very best value managers in the business. This is the man, after all, that literally invented value investing as we know it today with his publishing of The Intelligent Investor and Security Analysis. But would he still be hunting for stocks trading below their net current asset value per share, as he was famous for doing during the Great Depression? We can only guess. Let’s take a look under the hood of VALX. This guru ETF’s portfolio is comprised of 100 stocks using 10 distinct guru-based models, which are themselves chosen from a pool of 17 total models. The original pool of 17 is narrowed down to 10 based on their long-term performance and their correlation to each other. VALX is not beholden to any one strategy type; its 17 identifiable strategies are a mixture of value, growth and momentum strategies. VALX is also not hemmed in by market-cap restrictions; its holdings span the small-, mid-, and large-cap universes. So, what is VALX buying today? Let’s take a look at the current portfolio . There are definitely some contrarian plays in the portfolio. Russian oil company Lukoil ( OTCPK:LUKOY ) and battered American handbag maker Coach (NYSE: COH ) are current top holdings, as is oilfield servicer National Oilwell Varco (NYSE: NOV ). So, what’s the verdict on the Validea Market Legends ETF? It’s too early to draw any conclusions based on performance, as the ETF has only been trading since December, but its methodology is interesting and warrants following. It’s definitely worth noting that the ETF’s manager, John Reese, is a respected researcher and a long-time contributor to Forbes. For the individual stock pickers out there, VALX-along with the other guru ETFs GURU, ALFA and IBLN-can be used as a convenient stock screener for investment ideas and a launching pad for further research. Disclaimer: This article is for informational purposes only and should not be considered specific investment advice or as a solicitation to buy or sell any securities. Sizemore Capital personnel and clients will often have an interest in the securities mentioned. There is risk in any investment in traded securities, and all Sizemore Capital investment strategies have the possibility of loss. Past performance is no guarantee of future results. Original Post

A New Event Debt ETF Filed By Eccles Street – ETF News And Commentary

A wide variety of products have been launched in the ETF world so far this year by several providers, big and small. Continuing this trend, Eccles Street Asset Management, which is a new player in the industry, looks to launch an active ETF targeting the fixed income ETF space. After all, every player is in a mad rush to tap the income/yields space, thanks to the global growth worries and the subsequent plunge in yields. The Proposed ETF in Focus Eccles Street Event Driven Opportunities ETF revolves around corporate bonds and bank loans having average portfolio duration of about 3-5 years, per the prospectus . Underlying securities will have maturity period within the same time range. The instruments are touted as “event-driven” as these revolve around corporate events. The Eccles Street Event Driven Opportunity ETF will also invest in equities, especially credit-related ETFs and ETNs. How Do These Fit in a Portfolio? The product could be an interesting choice for investors seeking a play in the bond market, which zeros in on high yielding securities. These products are for investors who wish to stay away from stock market volatility while at the same time seek a steady stream of cash flow from their portfolio. Moreover, these products also provide a big jump in yields as compared to treasuries when interest rates remain low. In the current environment, yield hungry investors view high yield corporate bonds as good sources to maximize current income in the form of interest, especially compared to other avenues which have low yields attached. Further, the short-to-intermediate span of the corporate bonds makes the ETF moderately interest-sensitive. With the Fed looking steadfast in its plan to raise the key rate this year, the shorter-end of the yield curve appears dicey. In such a backdrop, the intermediate-term bond ETFs might turn out as good picks. This is not the end though. The issuer is expected to choose less than investment grade securities, but the strengthening of corporate America should provide some cushion against default risks (read: 3 Ultra Safe Bond ETFs to Dodge Market Turmoil ). ETF Competition Peer pressure is presumably tough in the corporate bond ETF space. iShares iBoxx $ Investment Grade Corporate Bond Fund (NYSEARCA: LQD ) heads the space in terms of assets. The fund manages an asset base of over $20 billion, while charging investors just 15 basis points as fees. The fund has returned about 3% so far this year and has a yield of 3.03% (as of January 29, 2015) (read: Best and Worst Bond ETFs Of 2014 ). Another popular choice in the intermediate corporate bond ETF space that could be a threat to the newly filed product is iShares Intermediate Credit Bond ETF (NYSEARCA: CIU ) with an asset base of $6.36 billion. Yield-wise, SPDR Barclays Capital Long Term Corporate Bond ETF (NYSEARCA: LWC ) comes at the top producing 3.74% (as of January 29, 2015) (read: 3 Income ETFs to Watch if Rates Stay Low ). Thus, to garner enough investor confidence, the issuer needs to price its product competitively. The issuer also needs to watch that the yield factor – the main agenda of the product – is competitive.