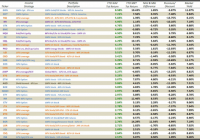
Summary What started as a rotation in 2015 has become more of the same over the last couple weeks as leading sectors such as technology and healthcare have reasserted themselves. But beneath the surface, there are tell tale signs of a rotation going on, particularly in interest rate sensitive sectors such as utilities and REITs. Equity CEFs are a great way to play a rotation because opportunities can arise regardless of which sectors are doing well and which sectors are falling out of favor. Well, it appears we’re back to the races on the major market averages after a short 5-week funk in which leading sectors such as technology and healthcare struggled while a rotation into energy, gold and commodities gained steam. But that didn’t last very long and once again, a rising tide appears to be lifting all boats as the markets look poised to take another leg up to new highs yet again. It’s become an old habit but the key is not so much to know which way the markets are going as it is to have investments that can take advantage of whichever way the markets are going and equity CEFs offer some of the best opportunities for that since they are constantly going in and out of favor along with the sectors they invest in. So let’s first look at what equity CEFs are performing the best after six weeks into the new year and see if we can glean any opportunities from these tables. The first table sorts all of the funds I follow (only 30 out of about 100 can be shown in a screen shot) by their total return NAV performances YTD through February 13th. Total return means all distributions are added back though not on a reinvested basis. Fund’s shown in green have outperformed the S&P 500, which is up 2.06% over the same period YTD. (click to enlarge) At the top of the list are two funds I recommended at the end of last year, the Gabelli Global Gold, Natural Resource & Income fund (NYSEMKT: GGN ) and the Gabelli Natural Resources, Gold & Income fund (NYSE: GNT ) . I recommended them not so much because I knew their sectors would come back into favor but purely because of their historical market price performance that tended to flip flop at the end of one year to the beginning of the next. This is a good example of what you can find in equity CEFs and even if you’re wrong about market direction or sector rotation, you can still be right about the direction of the equity CEFs you invest in. As it turned out, gold prices helped support both fund’s NAVs as well as their market prices but it doesn’t always work that way. Take a look at the next two funds on the list, the Cohen & Steers Quality Income Realty fund (NYSE: RQI ) and the Cohen & Steers Total Return Realty fund (NYSE: RFI ) . Their NAV’s have performed well so far in 2015, as have most REITs, but yet their market prices are telling you something very different, especially more recently. But at a -13.7% market price discount for RQI and -10.1% discount for RFI, do they represent good value even after a strong January jobs and wage report released earlier this month which is putting pressure on all interest rate sensitive sectors? I think so and I would be more inclined to pull some profits out of GGN and GNT and rotate them over to RQI and RFI at this point even if this rotation out of interest rate sensitive sectors continues. REITs had been one of the strongest sectors in the markets over the past year though you wouldn’t know it by looking at RQI’s and RFI’s Premium/Discount charts. RQI’s 1-Year Premium/Discount Chart RFI’s 1-Year Premium/Discount Chart Certainly, investors are trying to get ahead of the curve in REITs in anticipation of any Federal Reserve moves on interest rates later this year but sometimes they can get too far ahead, particularly in CEFs, and I believe this is one of those situations. I would also be looking at the Alpine Global Premier Property fund (NYSE: AWP ) , which has seen negative market price performance YTD despite a strong NAV performance as well (see table below). When Sector Rotations Give You Opportunities In CEF Prices One of the best ways to find opportunities in equity CEFs is to look at the difference between a fund’s NAV price performance and its market price performance since this can often tell you and what sectors are going in or out of favor by investors, often incorrectly. And in a year like 2015, you can often find wide variations in these two performances. Here is the same table from above sorted by the NAV & Market Price Difference column. Note: Fund’s in green have seen their NAV performance outdistance their market price performance whereas fund’s in red have not (table at bottom) . As you can see, AWP along with RQI and RFI are towards the top of the list as are a couple of energy MLPs, the Tortoise MLP fund (NYSE: NTG ) and the ClearBridge Energy MLP fund (NYSE: CEM ) . The energy MLP CEFs are a great way to play a rotation back into the energy sector though these funds can be quite volatile. I include three of the largest and most well known energy MLP CEFs in my tables to be representative of the group, so I’m not necessarily recommending NTG or CEM over the others, of which there are about 25 MLP CEFs available to investors, but these give you an idea of how the sector has performed so far in 2015 and despite lagging market prices compared to their NAVs, many of these energy MLP CEFs are actually seeing improvement in their premium/discount levels of late. A NASDAQ-100 Index Play For those who would rather not take a gamble on sector rotations and would rather stick with what has worked in the past, one equity CEF is giving you an opportunity to play off of one of the strongest indexes over the last few years. The NASDAQ-100, as represented by the PowerShares QQQ Trust (NASDAQ: QQQ ) , is the most popular technology ETF and represents the largest 100 non-financial stocks on the NASDAQ. Since the end of 2011, which is about the time in which this uninterrupted ramp up for the US markets got started, QQQ is up almost 100%. Not too many funds have been able to compete with that. However, what if I told you you could buy an index CEF that correlates with QQQ, but you could buy it at an historically large discount and a 7.3% market yield? The Nuveen NASDAQ-100 Dynamic Overwrite fund (NASDAQ: QQQX ) is an option-income CEF which mimics the QQQ but with less volatility. By selling NASDAQ-100 index options against its NASDAQ-100 stock portfolio, QQQX may not have the NAV upside of QQQ in a strong technology market but it also will hold up better at the NAV level should the NASDAQ-100 struggle, like it did in January. So why is QQQX struggling at the #9 position in the table above just when QQQ is breaking out to new highs? Because Nuveen recently restructured all of their option-income CEFs last year and in the case of QQQX, there is a large overhang of shareholders from another fund that merged into QQQX that have been lightening up their exposure, either because they already owned QQQX or for some other reason. In any event, this has resulted in continued selling pressure on QQQX since the merger was completed on December 22nd, 2014 resulting in this Premium/Discount chart since then. Now QQQX, at a -6.5% discount, is not what I would consider to be at an uber wide discount, but for an index correlated fund in which you can be pretty confident that if the index it follows does well, then the fund’s NAV will also do well, a -6.5% discount combined with a windfall 7.3% market yield, is attractive. Note: I was actually short QQQX up until recently since I had a very large position in the fund that merged into QQQX and it made sense to arbitrage that large position by shorting QQQX. Conclusion Opportunities in equity CEFs can arise at any time and in any sector. You just have to keep watch. You can also find equity CEFs that are getting ahead of themselves at the market price level either because investors believe the sectors they invest in are coming back in vogue or just because investors think they may be undervalued. I’ll go over some of those funds in my next article since some of them are headscratchers but here’s a taste of what to expect by reversing the table above by the funds whose market prices have outperformed their NAVs so far in 2015. Any fund whose market price has outperformed its NAV by more than 5% is shown in red. Disclosure: The author is long QQQX, GGN, GNT, RFI, AOD, AGD. (More…) The author wrote this article themselves, and it expresses their own opinions. The author is not receiving compensation for it (other than from Seeking Alpha). The author has no business relationship with any company whose stock is mentioned in this article.